ICH Q1 — Stability Testing
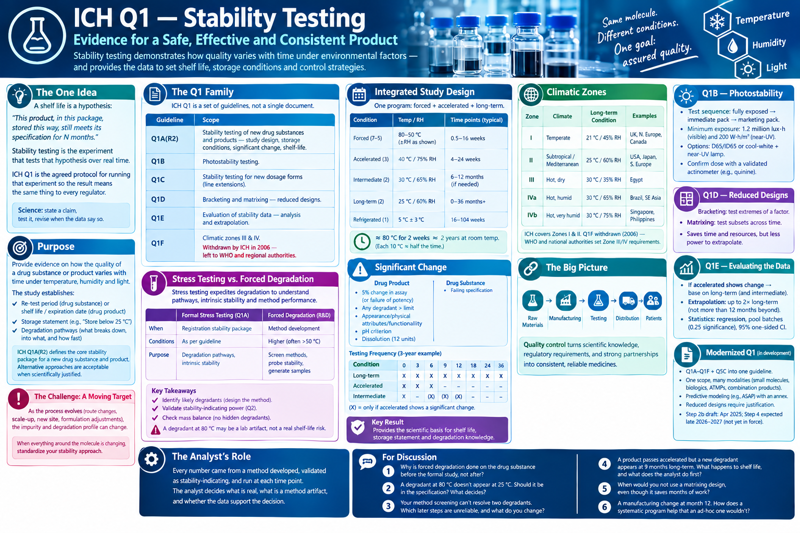
The one idea
A shelf life is a hypothesis: this product, in this package, stored this way, still meets its specification for N months. Stability testing is the experiment that tests that hypothesis over real time. ICH Q1 is the agreed protocol for running that experiment so that the result means the same thing to every regulator.
This is Lecture 1’s definition of science made concrete — you state a claim, you expose it to testing, and you are obligated to revise the shelf life (or the storage statement, or the formulation) when the data say so.
Purpose
The purpose of stability testing is to provide evidence on how the quality of a drug substance or drug product varies with time under the influence of a variety of environmental factors — temperature, humidity, and light.
From that evidence, and the scientific understanding of the molecule and the product, the study establishes three things:
- a re-test period (drug substance) or a shelf life / expiration date (drug product);
- the storage statement that goes on the label (“Store below 25 °C”, “Do not refrigerate”, and so on);
- the degradation pathways — what breaks down, into what, and how fast.
Q1A defines the core stability package expected for a new drug substance and product. It is a floor, not a straitjacket: alternative approaches are acceptable when they are scientifically justified.
The challenge: a moving target
Here is what makes stability hard in practice. The process by which the drug substance and drug product are made changes as development proceeds — the synthetic route is improved, the scale goes up, the site moves, the formulation is adjusted. Every one of those changes can shift the impurity and degradation profile, which means the “scientific understanding” you were leaning on has to be re-evaluated.
When everything around the molecule is changing, standardize your stability approach.
Fixed conditions, fixed pull points, fixed stability-indicating methods, fixed reporting — the discipline of a systematic program is exactly what lets you compare a batch made this quarter against one made two years ago and actually learn something from the difference.
The Q1 family
ICH Q1 is not one document. It is a set:
| Guideline | Scope |
|---|---|
| Q1A(R2) | Stability testing of new drug substances and products — the core: study design, storage conditions, significant change, shelf-life assignment. |
| Q1B | Photostability testing. |
| Q1C | Stability testing for new dosage forms (line extensions of an already-approved product). |
| Q1D | Bracketing and matrixing — reduced study designs. |
| Q1E | Evaluation of stability data — how to analyze it and how far you may extrapolate. |
| Q1F | Stability data for climatic zones III & IV. Withdrawn by ICH in 2006 — left to WHO and regional authorities. |
Stress testing and forced degradation
Stress testing is the process of subjecting the drug substance and/or drug product to elevated storage conditions that expedite chemical and physical transformations. The molecule is deliberately degraded with heat, high humidity (75 % RH or greater), acid and base hydrolysis across a pH range, oxidation, and photolysis.
It shows up in two related but distinct activities:
| Formal stress testing (ICH Q1A) | Forced degradation in R&D | |
|---|---|---|
| When | Part of the registration stability package | Early, during method development |
| Conditions | As outlined in the guideline | Higher — often > 50 °C — for faster answers |
| Purpose | Establish degradation pathways and intrinsic stability | Screen candidate methods, probe fundamental stability, generate degraded samples |
The R&D screening logic is simple: no reaction at the higher temperature → the lower temperatures are very likely fine. Reaction at the higher temperature → confirm it at the formal, “traditional” study conditions before it means anything for the label.
Advantage. Stress testing provides insight into — and a forecast of — the likely degradation products. That helps establish the degradation pathways, the intrinsic stability of the molecule, and, critically, it validates the stability-indicating power of the analytical procedures. The nature of the stress testing depends on the individual drug substance and the type of drug product involved.
Disadvantage. Some chemical and physical transformations observed at higher temperatures do not occur at normal storage conditions, because the activation energies of the processes differ. A degradant that only appears at 80 °C may be a lab artifact, not a shelf-life risk.
For the analyst, the point is not the formal shelf life. The point is to:
- Identify the likely degradation products so the method is designed to see them.
- Demonstrate the analytical procedure is stability-indicating — it resolves the API from its degradants and can quantify them (ICH Q2 validation depends on this).
- Check mass balance — does the loss of assay account for the rise in degradation products? A gap means a degradant you are not detecting.
If you take one thing from Q1 into the lab: forced degradation is how you prove your method can be trusted to watch a product age.
The degradation chemistry
Every extra peak on a stability chromatogram is the product of a chemical reaction. Knowing which reactions a given molecule is prone to tells you what to look for, which conditions accelerate it, and how to build a method that will actually see it. The common routes:
| Reaction | What happens | Examples |
|---|---|---|
| Hydrolysis | Water cleaves a bond — usually an ester, amide, or lactam. Acid- and base-catalysed, so strongly pH-dependent. | Aspirin → salicylic acid + acetic acid; β-lactams (penicillins) ring-open |
| Oxidation | Loss of electrons / gain of oxygen, by three routes: radical autoxidation (trace metals, peroxides, dissolved O₂), photo-oxidation (light, singlet oxygen), and chemical oxidants. | Catecholamines → coloured quinones; thioethers → sulfoxides; tertiary amines → N-oxides |
| Rearrangement | Bonds reorganise within the molecule — atoms migrate, connectivity changes, molecular formula often unchanged (an isomerisation). | Acyl migration in 1-O-acyl glucuronides; tetracycline → isotetracycline under base |
| Decarboxylation | A carboxylic acid loses CO₂, replacing –COOH with –H. | p-aminosalicylic acid → m-aminophenol + CO₂ |
| Dimerization / polymerization | Two (or many) API molecules join covalently through a reactive group. | Ampicillin / amoxicillin dimers and polymers |
| Reaction with excipients | The API reacts with a supposedly inert ingredient. | Maillard browning of amine drugs with lactose; oxidation by peroxides in povidone, PEG, or polysorbate |
| Racemization / epimerization | A stereocentre inverts — racemization gives a 50:50 enantiomer mix (optical activity lost); epimerization changes one centre of several. | Thalidomide racemization; tetracycline → 4-epi-tetracycline |
| Polymorphic conversion | No bonds change — the crystal repacks into a more stable form, altering dissolution and bioavailability. | Ritonavir (1998): a new, more stable form appeared and capsules failed dissolution |
Rearrangement. An intramolecular reaction that reorganises the bonding without adding or removing atoms, so the degradant is an isomer of the parent. Because the mass is often unchanged, LC–MS alone will not resolve it from the parent — you need retention, UV spectrum, and sometimes NMR. Acyl glucuronides are a clean example: the acyl group migrates around the sugar ring (1-O → 2-, 3-, 4-O), and the rearranged isomers are the ones that bind covalently to protein.
Decarboxylation. Loss of the carboxyl group as carbon dioxide. It is fast when the carbanion or enol left behind is stabilised — β-keto acids, or aromatic acids with an activating group ortho or para. p-Aminosalicylic acid is the textbook drug example: it decarboxylates to m-aminophenol on mild heating or in solution, which is why PAS discolours on storage.
Dimerization. Two API molecules combine into one covalent species; polymerization is the same reaction run many times. It needs a reactive handle — a β-lactam carbonyl, an aldehyde, an activated alkene, a free thiol. In the aminopenicillins the side-chain amine of one molecule opens the β-lactam of another; the resulting dimers and higher polymers are implicated in penicillin allergy, so they are controlled tightly.
Solution phase vs. solid state. The same molecule degrades differently in the two. In solution it is fully solvated and surrounded by water, so hydrolysis and dissolved-oxygen oxidation dominate and the kinetics are usually clean Arrhenius. In the solid state the molecules are locked in a lattice; reaction happens at surfaces, crystal defects, and amorphous or disordered regions, and is often governed by water sorbed onto the surface rather than bulk water — so rates can be non-Arrhenius and show a moisture threshold. This is why solid-state and solution stress testing are designed and reported separately.
Apparent degradation (recovery). Sometimes the assay comes back low and nothing has actually degraded — the drug has adsorbed onto glass, tubing, or a filter (common for peptides and low-dose products), extraction from the matrix was incomplete, or the reference standard itself has drifted. The check is mass balance again: real degradation shows a matching rise in degradation products; a recovery problem shows a loss with no new peaks. Rule out recovery before you call something degradation.
The degradant-profiling workflow
Forced degradation is not a one-off experiment. It is the first active step in a repeatable, iterative degradant-profiling workflow that runs from what might break all the way to documented structures and mechanisms. One widely cited version (Alsante et al., Adv. Drug Deliv. Rev. 59(1), 2007, 29–37) has eight steps:
| # | Step | What it involves | Covered in |
|---|---|---|---|
| 1 | Predict degradants | A degradation database, prediction tools (e.g. CAMEO), and organic-chemistry knowledge | prior knowledge / organic chemistry |
| 2 | Design the protocol | A forced-degradation protocol built around the actual chemistry of the API and the drug-product formulation | above |
| 3 | Perform the experiments | Stress under reasonable conditions; sample at appropriate points | above |
| 4 | Challenge the methodology | HPLC screening of the stressed samples with a suitable screening method | Q2 · Validation |
| 5 | Evaluate purity / potency | Purity and potency data; check mass balance; confirm peak purity of the main band by diode-array and LC–MS | Q2 · Validation |
| 6 | Select key degradants / track peaks | The primary degradants (roughly ≥ 10 % of total degradation), tracked across orthogonal methods | Q3 · Impurities |
| 7 | Identify degradants | LC–MS, LC–NMR, preparative isolation (column chromatography, TLC, prep-LC), and synthesis | Q3 · Impurities |
| 8 | Document degradants & mechanisms | Report the structures and mechanisms; feed a degradation database for reuse | Q3 · Impurities / lifecycle knowledge |
Steps 2–3 are covered above. Steps 4–5 are stability-indicating method development. Steps 6–8 are degradant identification and knowledge capture. And the loop is iterative — a new degradant seen at a later time point, or after a process change, sends you back to step 2 (see The challenge: a moving target).
(Instructor: confirm the citation detail before lecture.)
One program: forced, accelerated, and long-term together
The formal ICH study (the next section) answers the regulator, but on its own it is slow — it is months before it tells the development team whether they are in trouble, and it does not generate degraded material early enough to build methods against. In practice the formal study is run as part of one coordinated program that also spans forced and extra accelerated conditions on a common schedule.
The lever is temperature. As a rule of thumb, a reaction’s rate roughly doubles for every 10 °C (an Arrhenius approximation, Q10 ≈ 2). A marketed formulation is expected to carry about a two-year shelf life, and you cannot wait two years for that answer during development, so higher stressing temperatures stand in for elapsed time. On the doubling rule, ≈ 80 °C for two weeks ≈ two years at room temperature (take room temperature as ≈ 25 °C, the ICH long-term condition):
| Stress temperature (°C) | 20 | 30 | 40 | 50 | 60 | 70 | 80 |
|---|---|---|---|---|---|---|---|
| Time to a 2-year-equivalent exposure (weeks) | 128 | 64 | 32 | 16 | 8 | 4 | 2 |
Each additional 10 °C halves the time.
A single fast data point is fragile, though, so you set up a gradient of conditions — hot enough for an early read and for method-development samples, mild enough to be relevant, all pulled on one schedule:
| Level | Stressing condition | 1st pull (wks) | 2nd pull | 3rd pull | 4th pull |
|---|---|---|---|---|---|
| 7 — forced | 80 °C | 0.5 | 1 | 1.5 | 2 |
| 6 — forced | 70 °C | 1 | 2 | 3 | 4 |
| 5 — forced | 60 °C / 75 % RH | 2 | 4 | 6 | 8 |
| 4 — forced | 50 °C | 4 | 8 | 12 | 16 |
| 3 — accelerated (ICH) | 40 °C / 75 % RH | 4 | 8 | 16 | 24 |
| 2 — long-term (ICH) | 25 °C / 60 % RH | 16 | 24 | 52 | 104 |
| 1 — refrigerated | 4 °C | 16 | 24 | 52 | 104 |
One program then gives you two things from the same set of samples: an early read within weeks (are we in trouble?) and the long-term read that supports the filing. The caveat is the disadvantage noted under Stress testing and forced degradation — the forced levels are a screen and a forecast, not the registration answer. Anything they flag is confirmed at ICH conditions before it drives a shelf-life or storage decision.
The formal study design
Batches. At least three primary batches, same synthetic route / manufacturing process, at least pilot scale, in the container closure system proposed for marketing.
Storage conditions (general case):
| Study | Condition | Minimum data at submission |
|---|---|---|
| Long-term | 25 °C ± 2 °C / 60 % RH ± 5 % RH (or) 30 °C ± 2 °C / 65 % RH ± 5 % RH | 12 months |
| Intermediate | 30 °C ± 2 °C / 65 % RH ± 5 % RH | 6 months |
| Accelerated | 40 °C ± 2 °C / 75 % RH ± 5 % RH | 6 months |
If 30 °C / 65 % RH is chosen as the long-term condition, there is no separate intermediate condition.
| Intended storage | Long-term | Accelerated |
|---|---|---|
| Refrigerated | 5 °C ± 3 °C | 25 °C ± 2 °C / 60 % RH ± 5 % RH |
| Frozen | −20 °C ± 5 °C | (none — test one batch at ~5 °C or ~25 °C for a comparable period) |
Products in semi-permeable containers (e.g. LDPE bags, plastic ampoules) are also tested for water loss at low humidity (40 °C / not more than 25 % RH).
Testing frequency. Long-term: 0, 3, 6, 9, 12, 18, 24 months, then annually through the proposed shelf life. Accelerated: 0, 3, 6 (minimum three points). Intermediate: 0, 6, 9, 12 (minimum four points). A worked schedule for a three-year study, where X is a scheduled pull and (X) is performed only if the accelerated condition shows a significant change:
| Condition | 0 | 3 | 6 | 9 | 12 | 18 | 24 | 36 |
|---|---|---|---|---|---|---|---|---|
| Long-term — 25 °C / 60 % RH | X | X | X | X | X | X | X | X |
| Accelerated — 40 °C / 75 % RH | X | X | X | |||||
| Intermediate — 30 °C / 65 % RH | X | (X) | (X) | (X) |
“Significant change”
At the accelerated condition, significant change triggers intermediate testing, and the shelf life is then based on long-term data. For a drug product, significant change is any of:
- a 5 % change in assay from the initial value (or failure to meet the potency criterion for a biological/immunological method);
- any degradation product exceeding its acceptance criterion;
- failure to meet acceptance criteria for appearance, physical attributes, or functionality (some physical changes are expected under accelerated stress — e.g. softening of a suppository — and are judged in context);
- failure to meet the pH criterion;
- failure of dissolution for 12 units.
For a drug substance, significant change is simply failure to meet specification.
Climatic zones and why Q1F was withdrawn
| Zone | Climate | Long-term condition | Examples |
|---|---|---|---|
| I | Temperate | 21 °C / 45 % RH | UK, Northern Europe, Canada |
| II | Subtropical / Mediterranean | 25 °C / 60 % RH | USA, Japan, Southern Europe |
| III | Hot, dry | 30 °C / 35 % RH | Egypt |
| IVa | Hot, humid | 30 °C / 65 % RH | Brazil, much of SE Asia |
| IVb | Hot, very humid | 30 °C / 75 % RH | Singapore, Philippines |
ICH covers Zones I and II. Q1F was withdrawn in 2006 because the ICH regions do not include Zone III/IV countries; WHO and national authorities now set those requirements (WHO recommends 30 °C / 75 % RH long-term for Zone IVb).
Q1B — photostability (in brief)
Test sequence: fully exposed product → immediate pack → marketing pack, stopping once you have enough information. Minimum exposure: 1.2 million lux·hours (visible) and 200 W·h/m² (near-UV). Two lighting options — a D65/ID65 daylight standard (Option 1) or cool-white fluorescent plus a near-UV lamp (Option 2). Light dose is confirmed with a validated actinometer (e.g. quinine).
Q1D — bracketing and matrixing (reduced designs)
- Bracketing — test only the extremes of a design factor (strength, container size, fill) at every time point, on the assumption that the extremes bound the intermediates.
- Matrixing — test a subset of samples at each time point, a different subset at the next, so the full matrix is covered across the study but not at every pull.
- The trade-off — less data means less power to extrapolate. If the data turn out variable, a reduced design may not support the shelf life you wanted, and there is no going back in time.
Q1E — evaluating the data
- If accelerated data show significant change, base the shelf life on long-term (and intermediate) data.
- Extrapolation — with long-term and accelerated data showing little change and little variability, you may propose a shelf life up to 2× the long-term data period, but not more than 12 months beyond it.
- Statistics — regression analysis of each attribute against time; test whether batches can be pooled using analysis of covariance at a 0.25 significance level; the shelf life is the earliest time the 95 % one-sided confidence limit for the mean crosses an acceptance criterion.
Modernization — the revised Q1
ICH is consolidating Q1A–Q1F and Q5C (the biologics stability guideline) into a single modernized Q1 — one unified lifecycle framework (the Step 2b draft runs to roughly 108 pages) that pulls stability testing away from a prescriptive checklist and toward a science- and risk-based strategy, aligned with quality by design and with post-approval lifecycle management (Q12).
The concept paper was endorsed in 2022; the Step 2b draft was released in April 2025, and its public consultation closed late in 2025. Step 4 adoption is anticipated in the late-2026 to 2027 window — so it is not in force yet, but protocols written now will be reviewed under it.
Three shifts matter for how you would design a study:
- One scope, many modalities. Rather than guessing which parts of the old series apply to a given product, the new guideline is a common baseline with product-class annexes — synthetic small molecules (including oligonucleotides and peptides), biologics and vaccines (subsuming Q5C), advanced therapy medicinal products (cell and gene therapies), and drug–device combination products.
- Predictive modeling gets a regulatory home. A dedicated annex formalizes mathematical and statistical stability modeling — accelerated-assessment approaches such as ASAP that were previously accepted only case by case. Modeled data can be used to justify shelf-life extrapolation and, in some early filings, to stand in for part of the traditional long-term study.
- Reduced designs must be earned. Bracketing and matrixing (Q1D) move from protocol templates to a defended position: prior knowledge and platform data, a risk assessment tied to the product and its container closure system, and analytics that show statistically that the reduced matrix will not compromise trend detection.
Because stability studies are multi-year commitments, CMC teams writing protocols today are already auditing their SOPs so they don’t lock legacy assumptions into submissions that will be assessed against the new framework.
(Status as of early 2026 — Step 4 not yet adopted; confirm before lecture.)
Where the analyst sits
Every number in a stability report came from a method an analyst developed, validated as stability-indicating, and ran at each time point — sometimes for years. The judgment calls are analytical: is that a real new peak or a column artifact? Does mass balance close? Is the trend real or within method variability? Q1 is the framework; the analyst is the instrument that makes it mean something.
For discussion
- Why is forced degradation done on the drug substance before the formal study, not after?
- Forced degradation at 80 °C produces a degradant you never see at 40 °C or 25 °C. Does it belong on the specification? What decides?
- A molecule has an ester, a secondary amine, and a stereocentre α to a carbonyl. Which degradation reactions would you screen for first, and which stress condition targets each?
- Your method screening (step 4 of the degradant-profiling workflow) can’t resolve two degradants that co-elute. Which later steps are now unreliable, and what do you change?
- A product passes accelerated but a new degradant appears at 9 months long-term. What happens to the shelf life, and what does the analyst have to do first?
- When would you not use a matrixing design, even though it would save the lab months of work?
- The manufacturing process changed at month 12 of a stability study. What does a systematic stability program let you do that an ad-hoc one would not?