ICH Q13 — Continuous Manufacturing
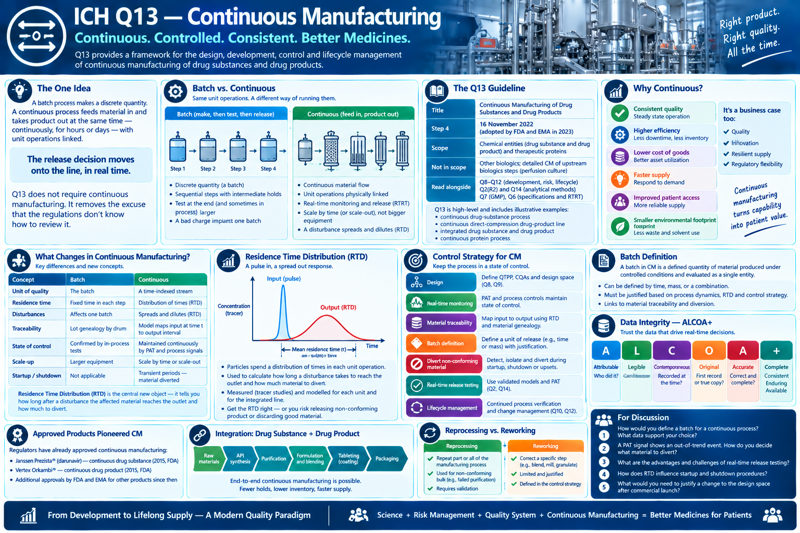
The one idea
A batch process makes a discrete quantity of material in a sequence of contained steps, and quality is judged step by step and at the end. A continuous process feeds material in and takes product out at the same time, continuously, for hours or days, with the unit operations physically linked. There is no lot sitting in a drum waiting for a release decision — so the release decision has to move onto the line, in real time.
Q13 does not require continuous manufacturing. It removes the excuse that the regulations don’t know how to review it.
Everything Q13 adds — residence time distribution, material traceability, diversion logic, the batch definition — exists to answer one question that batch manufacturing answered by construction: which material is in specification, and how do I know?
The Q13 guideline
| Title | Continuous Manufacturing of Drug Substances and Drug Products |
| Step 4 | 16 November 2022; adopted by FDA and EMA in 2023 (Health Canada, PMDA, and others following) |
| Scope | Chemical entities (drug substance and drug product) and therapeutic proteins. Applies to new products, to conversion of an approved batch process, and to production-volume changes |
| Explicitly out of scope | Other biologics, and the detailed CM of the upstream biologics steps (perfusion culture) — flagged for future work |
| Read alongside | Q8–Q12 (QbD, design space, control strategy, lifecycle), Q2(R2) and Q14 (the analytical methods and their development), Q7 (GMP), Q6 (specifications and RTRT) |
Q13 is deliberately short on prescription and long on illustrative examples — it carries annexes working through a continuous drug-substance process, a continuous direct-compression drug-product line, integration of drug substance and drug product, and a continuous protein process. It codifies concepts that companies and the FDA Emerging Technology Program / EMA PAT Team had been negotiating case by case since about 2015.
What “continuous” actually changes
| Concept | Batch | Continuous |
|---|---|---|
| The unit of quality | The batch — made, then tested, then released | A time-indexed stream; quality is a function of when material passed each point |
| Residence time | Every particle in a step spends the same time there | Particles spend a distribution of times in each unit — the residence time distribution (RTD) |
| Disturbances | A bad charge contaminates one batch | A disturbance (feeder refill, moisture spike, blend upset) travels down the line, spreading and diluting as the RTD dictates |
| Traceability | Lot genealogy by drum | Material traceability — a model that maps input material at time t to the product interval it ends up in, so an out-of-spec input can be traced to the exact grams to divert |
| State of control | Confirmed by in-process tests at defined points | Confirmed continuously by PAT and process signals; the process must stay in a state of control, and departures must be detected fast |
| Scale-up | Lab → pilot → commercial, each a new risk | No scale-up — the commercial line is the development line; more output means a longer run (“scale by time” / scale-out), not bigger equipment |
| Startup / shutdown | Not applicable | Transient periods where the process is not yet at steady state — material made then is diverted unless the control strategy justifies keeping it |
Residence time distribution (RTD) is the central new object. It is measured (tracer pulse studies) and modelled for each unit operation and for the integrated line. It tells you three things you cannot otherwise know: how long after a disturbance the affected material reaches the outlet, how much that disturbance is smeared out (a sharp input spike becomes a broad, lower bump), and therefore how much material to divert and when. Get the RTD wrong and you either ship non-conforming product or throw away good material.
Why do it — the cost–benefit rationale
This is the question a manufacturing director asks first. The honest answer is that CM front-loads cost and expertise for benefits that are partly operational and partly strategic.
The case for.
- No scale-up. Development happens at commercial scale. Fewer registration and stability batches, less tech-transfer risk, and typically faster to market — the step that historically breaks (scale-up) is deleted.
- Smaller footprint, lower capital. Equipment is bench-to-room scale; a CM line can replace a suite of large vessels and the building around them. Facilities are cheaper to build and to qualify.
- Flexible supply. Output is set by run time. You can match production to demand, ramp quickly for a launch or a shortage, and run the same line for clinical and commercial supply. This is the drug-shortage and supply-resilience argument that now drives policy interest and onshoring incentives.
- Quality built in. PAT plus real-time release means non-conforming material is diverted continuously in grams, not discovered as a failed batch and rejected in kilograms. Less waste, fewer investigations, fewer rejected lots.
- Fewer manual operations. Integrated, closed transfers mean less operator handling, lower contamination risk, and lower exposure for potent compounds.
- Greener. Often less solvent, less energy, less intermediate isolation.
The case against (the costs).
- Upfront investment in equipment, PAT instrumentation, process modelling, automation, and the data infrastructure to run and record it all.
- New expertise. Process dynamics, RTD characterisation, chemometrics / model building, and real-time process control are not traditional pharma skill sets. The Q14 analytical-development burden goes up, not down.
- Model lifecycle. Every PAT model is an asset that drifts, needs monitoring, and needs a managed-change path (Q10/Q12). Maintenance is permanent.
- Transient handling. Startup, shutdown, and disturbance recovery all produce material of uncertain quality; the diversion logic has to be designed, justified, and validated.
- Uneven regulatory reward. Q13 harmonised the science, but regional implementation and inspector familiarity still vary; a global filing can meet different expectations in different markets.
- Not always worth it. A very high-volume commodity, or a stable legacy product with a fully depreciated batch plant, may never repay the conversion.
The rule of thumb: CM pays off fastest for new molecules (capture the no-scale-up benefit from the start), for potent or hazardous chemistry (containment), and where agile supply has real value. It pays off slowest as a retrofit of a mature, high-volume, low-margin product.
Examples — products already made this way
Continuous manufacturing is not hypothetical; a growing list of approved products use it, mostly oral solid dosage forms via continuous direct compression or continuous wet granulation.
| Product | Company | Milestone |
|---|---|---|
| Orkambi (lumacaftor/ivacaftor) | Vertex | 2015 — first FDA-approved product with a continuous drug-product process |
| Prezista (darunavir) | Janssen | 2016 — first approval of a switch from batch to CM for a marketed product (Gurabo, Puerto Rico site) |
| Verzenio (abemaciclib) | Eli Lilly | 2017 — developed and launched on a continuous line |
| Symdeko / Symkevi (tezacaftor/ivacaftor) | Vertex | 2018 |
| Daurismo (glasdegib) | Pfizer | 2018 |
| Lagevrio (molnupiravir) | Merck | 2021–22 — CM cited as key to compressing development and scaling supply during the pandemic |
Continuous drug-substance manufacture (flow chemistry, continuous crystallisation) and continuous biologics downstream processing (periodic counter-current chromatography, single-pass tangential-flow filtration) are further behind in approvals but are exactly what Q13’s drug-substance and protein annexes address. Continuous upstream culture (perfusion) is used commercially for some proteins but sits at the edge of Q13’s stated scope.
(Instructor: confirm each approval year and the batch-vs-CM detail before lecture — several of these are widely cited but the public record is thin on process specifics, and companies rarely disclose which unit operations are continuous.)
The control strategy Q13 adds
On top of the Q8–Q12 control strategy, a CM control strategy has to specify:
- Process dynamics and RTD — characterised for each unit operation and the integrated system; the basis for traceability and diversion.
- Material traceability — the method (often a validated model) that links a deviation at any input to the affected outlet material.
- Diversion strategy — where diversion valves sit, what triggers them (a PAT result, a process-signal excursion, a feeder fault), and how the diverted quantity is calculated from the RTD with a safety margin.
- State-of-control monitoring — the PAT and process signals watched in real time, their limits, and the response to an excursion.
- Startup and shutdown — how the process reaches steady state, how long that takes, and whether any of that material can be kept.
- Process models — each classified by risk (low / medium / high impact) per Q8–Q12 and Q14, with a verification and maintenance plan.
- Equipment and system integration — data architecture, control-system reliability, and what happens on a sensor or power failure.
Batch definition and disposition
Q13 keeps the regulatory concept of a batch — it just lets you define its size by any of:
- a quantity of input or output material,
- the quantity produced in a defined time interval, or
- the quantity produced by a defined number of equipment cycles or a defined variation of a process parameter.
Whatever the definition, GMP still applies: a batch has one record, one disposition decision, and defined homogeneity. Non-conforming material identified by the control strategy is diverted in real time and does not count toward the batch; the RTD tells you exactly how much to remove on either side of the event.
The analytical shift
This is where the section’s through-line lands. In batch QC the analyst takes a sample to the lab, runs a validated method, and reports a number days later. In CM the line measures itself and the analyst’s job moves upstream and sideways:
| Batch QC | Continuous / RTRT |
|---|---|
| Sample pulled, transported, prepared | Measurement in-line or on-line — NIR, Raman, in-line UV, FBRM, imaging — no sample removed |
| One validated method, one result | A calibration model (chemometrics) mapping a spectrum to concentration, uniformity, or particle size |
| Method validated once (Q2), then run | Model built, validated, and then monitored for drift for the life of the product |
| Result vs. acceptance criterion | Result feeds real-time release and, often, the process control loop |
| Analyst runs the assay | Analyst owns the model — reference-method correlation, outlier detection, revalidation after a raw-material or process change |
Real-time release testing (RTRT) replaces an end-product test with a validated in-process measurement plus a model — e.g. NIR content uniformity at the tablet press instead of the compendial CU test. The specification still lists the attribute and its limit (Q6); what changes is where and when it is measured, and the validation burden goes up because you are now validating an instrument, a model, and their maintenance rather than a single wet method.
Where the analyst sits
In a CM line the analyst is not at the end — they are embedded in the process. The chemometric model that decides whether a tablet interval is released is an analytical procedure: someone developed it against a reference method, validated it under Q2(R2) and Q14, set its outlier and drift limits, and answers for it every day. The RTD study that sets the diversion volume is an analytical measurement. When a feeder hiccups at 03:00 and the line diverts 400 g, the defensibility of that number — and of every gram kept — traces back to analytical work done months earlier.
If the Q1 lesson is a shelf life is a hypothesis and the Q2 lesson is a measurement is a claim that must earn trust, the Q13 lesson is: when the measurement moves onto the line, the analyst moves with it — from running assays to owning the models and the process understanding that let a product be released the moment it is made.
For discussion
- A batch process and a continuous process both make 100 kg of tablets. For each, explain how you would answer “is all of it in specification?” — and where the analytical work happens in each case.
- Why does converting an approved batch product to CM (like Prezista) count as a manufacturing change that needs review, and what does Q13 let the company avoid that they could not before?
- A moisture spike hits the granulator inlet for 20 seconds. Walk through how the RTD determines what gets diverted. What happens to your diversion decision if the RTD model is 30 % too narrow?
- RTRT for content uniformity by NIR drops the end-product test. What stays on the specification, what moves, and why does the method-validation burden go up?
- Give the cost–benefit case for CM to a director looking at a new small-molecule NCE versus the same director looking at a 30-year-old high-volume generic. Why are the answers different?
- The NIR calibration model starts drifting six months after launch. What could cause that, how would you detect it, and what is the regulatory path to updating the model (Q12 established conditions)?
- Q13 excludes continuous upstream biologics (perfusion culture) from its scope. What is different about that step that made ICH hold it back?
Source note. ICH Q13 Continuous Manufacturing of Drug Substances and Drug Products reached Step 4 on 16 November 2022 and was adopted by the FDA and EMA in 2023. It is read with Q8–Q12 (QbD, control strategy, lifecycle management), Q2(R2) and Q14 (analytical procedures and their development), Q7 (GMP), and Q6 (specifications and real-time release). The FDA’s companion guidance Quality Considerations for Continuous Manufacturing aligns with Q13. (Instructor: confirm the Step 4 date and the current list of regions that have adopted Q13; verify each product in the examples table — approval year and the batch-vs-CM detail — against a current source, since process specifics are rarely disclosed; check whether ICH has opened Q13 follow-up work on continuous biologics upstream processing. The overview graphic on this page is AI-generated and several words in it are garbled — regenerate or hand-correct it before lecture.)