ICH Q2 — Validation of Analytical Procedures
The one idea
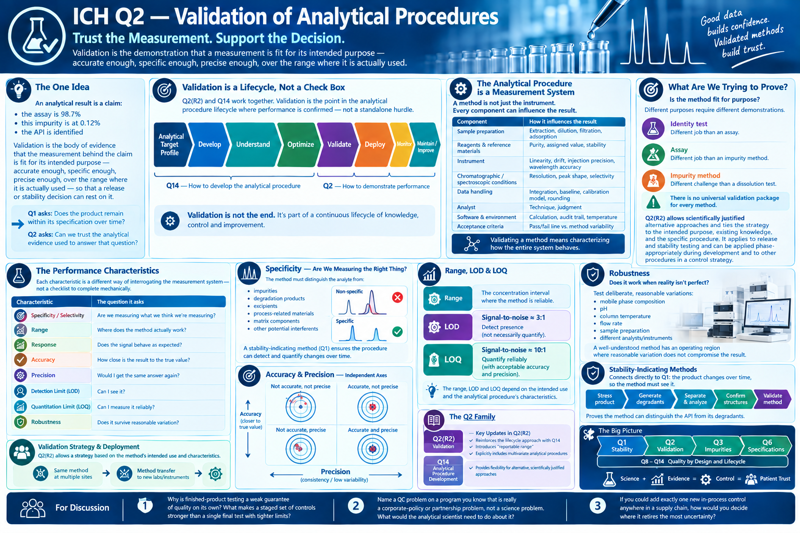
An analytical result is a claim: the assay is 98.7 %, this impurity is at 0.12 %, the API is identified. Validation is the body of evidence that the measurement behind the claim is fit for its intended purpose — accurate enough, specific enough, precise enough, over the range where it is actually used — so that a release or stability decision can rest on it.
This pairs directly with the previous section:
Q1 asks: does the product remain within its specification over time?
Q2 asks: can we trust the analytical evidence used to answer that question?
Without Q2, the conclusions from a stability study are only as good as an unexamined instrument reading. Q2(R2) (Step 4, November 2023; a minor error-correction document followed in 2025) is the current framework, and it was developed alongside Q14 — validation is now explicitly the point in an analytical procedure’s lifecycle where performance is confirmed, not a standalone hurdle.
Validation is not “checking the method”
The naïve mental model is a straight line:
develop method → validate method → use method
Q2(R2), read together with Q14, replaces it with a loop:
analytical target profile → develop → understand → optimize → validate → deploy → monitor → maintain / improve
Q14 is how you develop a procedure with scientific understanding and risk-based thinking. Q2 is the question:
Can we demonstrate that the resulting procedure performs adequately for the purpose we intend to use it for?
Validation is therefore not the moment science stops. It is a structured demonstration of what is already understood about the measurement system — and relevant data generated during development can contribute to the validation package rather than being repeated.
The challenge: a moving target
The same difficulty that shadows Q1 applies to the method. The synthetic route, the scale, the manufacturing site, and the formulation all change as a function of development time, and each change can shift the impurity and degradation profile the method was built to see. A method validated against last year’s material may need re-validation — to a degree that scales with the size of the change.
When everything around the molecule is changing, standardize your analytical approach.
Two defences hold the program together:
- A systematic approach — fixed conditions, fixed system suitability, fixed acceptance criteria, fixed reporting — so a result from this quarter is comparable with one from two years ago, and a change in the data means something.
- A multivariate / orthogonal approach — more than one procedure interrogating the same attribute by different physical principles (reversed-phase vs. HILIC, UV vs. MS, chromatography vs. spectroscopy). Q2 notes explicitly that a lack of specificity in one analytical procedure can be compensated by other supporting procedure(s).
The analytical procedure is a measurement system
The concept to fix for graduate students: a method is not HPLC + column + mobile phase + detector. It is a measurement system, and every element of it can move the reported number:
| Component | Examples of how it influences the result |
|---|---|
| Sample preparation | Extraction efficiency, dilution error, filtration losses, adsorption |
| Reagents and reference materials | Purity, assigned value, stability, water content |
| Instrument | Detector linearity and drift, injection precision, wavelength accuracy |
| Chromatographic / spectroscopic conditions | Resolution, peak shape, selectivity |
| Data handling | Integration parameters, baseline, calibration model, rounding |
| Analyst | Technique, judgment on integration and system suitability |
| Software and environment | Calculation, audit trail, temperature and humidity |
| Acceptance criteria | Where the pass/fail line sits relative to method variability |
Validating a method means characterizing how this whole system behaves when used for its intended purpose.
How the measurement works — light and matter
Almost every analytical procedure in this course comes down to the interaction of electromagnetic radiation with chemical species to produce a unit of measure. Different regions of the spectrum carry different amounts of energy and therefore probe different things — molecular rotations and vibrations in the infrared, valence electrons in the UV–visible, nuclear spin states in NMR, core electrons and nuclei at X-ray and γ-ray energies. Choosing a technique is choosing which energy levels you interrogate.
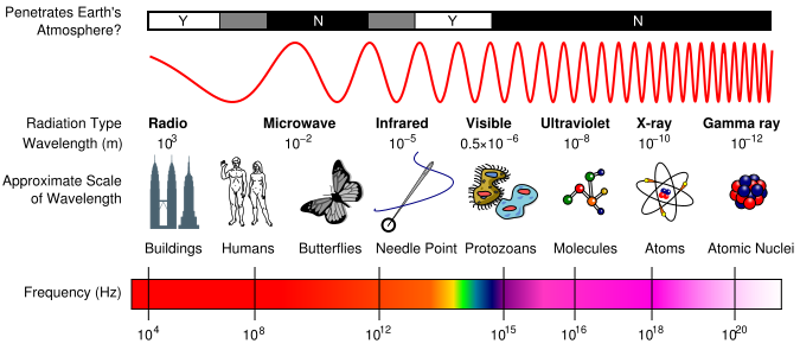
Two broad modes of measurement:
- Direct measurement — light in, signal out, with little or no sample preparation: near-infrared (NIR), infrared (IR), UV, visible, Raman. The result often comes from a model over a whole spectrum rather than a single wavelength — which is exactly what Q2(R2)’s multivariate section addresses.
- Separation first — resolve the mixture, then measure what comes off: thin-layer chromatography (TLC), HPLC/UHPLC, capillary electrophoresis (CE), gas chromatography, usually with a spectroscopic or mass-spectrometric detector at the end.
The validation characteristics are the same either way. What differs is where the variability enters the measurement system — and that is what shapes the validation design.
What are we trying to prove?
The fundamental question is: is the method fit for purpose? — and different purposes demand different demonstrations. An identity test has a different job from an assay; an assay has a different job from an impurity method; an impurity method at a 0.05 % reporting threshold has a different challenge from a dissolution test.
There is no universal validation package that every method must satisfy in the same way.
Q2(R2) sets the expected characteristics but explicitly permits scientifically justified alternative approaches, and it ties the validation strategy to the intended purpose and to what is already known about the procedure. It applies particularly to procedures used for release and stability testing; its scientific principles apply phase-appropriately during development and to other procedures in a control strategy.
Types of analytical procedure to be validated
Q2 organizes everything around four procedure types, because the validation you owe depends on the job the procedure does:
| Type | What it does |
|---|---|
| Identification test | Confirms the identity of an analyte in a sample — normally by comparing a property of the sample (spectrum, chromatographic behaviour, chemical reactivity) against a reference standard. |
| Quantitative test for impurities | Measures the amount of an impurity present, to reflect the purity of the sample. |
| Limit test for impurities | Decides only whether an impurity is above or below a threshold — no exact value. It needs a different set of characteristics from the quantitative test. |
| Assay — quantitative test of the active moiety | Measures the content or potency of the major component: the drug substance, or the active (or another selected component) in the drug product. The same characteristics extend to assays behind other procedures, such as dissolution. |
- Identification tests ensure the identity of an analyte — the sample property is matched to that of a reference standard.
- Impurity testing — quantitative or limit — must accurately reflect the purity characteristics of the sample. A quantitative test and a limit test require different validation characteristics: the quantitative test has to be accurate and precise at low levels; the limit test only has to detect reliably at the limit.
- Assay procedures measure the analyte present in a sample. For the drug substance the assay quantifies the major component; for the drug product the same characteristics apply when assaying the active or another selected component, and also to assays associated with procedures such as dissolution.
The performance characteristics — the analytical figures of merit
These are the vocabulary of Q2 — the analytical figures of merit. Defining each one for a given method describes the design space in which the method can effectively operate and measure the quality of the process. Each is a different way of interrogating the measurement system — not a checklist to complete mechanically. Know these cold; they are the concept most likely to be tested.
| Characteristic | The question it asks |
|---|---|
| Specificity / selectivity | Are we measuring what we think we’re measuring, in the presence of everything else? |
| Response | How does the analytical signal behave as concentration changes? (subsumes the former linearity) |
| Range | Over what concentration interval does the method perform suitably? |
| Accuracy | How close is the result to the true or accepted reference value? |
| Precision | How much do repeated measurements vary — within a run, across days/analysts, across labs? |
| Detection limit (DL) | At what level can we reliably tell an analyte is present? |
| Quantitation limit (QL) | At what level can we reliably measure how much is present? |
| Robustness | How sensitive is the method to small, deliberate changes in operating conditions? |
Q2(R2) reorganizes some of this. Linearity is folded into response; the working range is discussed in terms of a reportable range tied to the intended use rather than a generic instrument property; selectivity/specificity are treated together; and the guideline adds explicit coverage of multivariate procedures and of stability of solutions and samples as part of the package.
The classic Q2 list — the one to memorize — is:
- Accuracy
- Precision — repeatability and intermediate precision (and, between laboratories, reproducibility)
- Specificity
- Detection limit
- Quantitation limit
- Linearity
- Range
The figures of merit — formal definitions
These are the definitions to be able to state precisely:
| Term | Definition |
|---|---|
| Accuracy | The closeness of agreement between the value which is accepted either as a conventional true value or an accepted reference value, and the value found. |
| Precision | The closeness of agreement (degree of scatter) between a series of measurements obtained from multiple sampling of the same homogeneous sample under the prescribed conditions. Considered at three levels: repeatability, intermediate precision, reproducibility. |
| Repeatability | Precision under the same operating conditions over a short interval of time. Also termed intra-assay precision. |
| Intermediate precision | Within-laboratory variation: different days, different analysts, different equipment. |
| Reproducibility | Precision between laboratories (collaborative studies, usually for standardization of methodology). |
| Specificity | The ability to assess unequivocally the analyte in the presence of components which may be expected to be present — typically impurities, degradants, matrix. A lack of specificity in one procedure may be compensated by other supporting procedure(s). |
| Detection limit (LOD) | The lowest concentration of analyte that can be determined to be statistically different from a blank — detected, but not necessarily quantitated as an exact value. |
| Quantitation limit (LOQ) | The lowest level above which quantitative results may be obtained with a specified degree of confidence (acceptable accuracy and precision). |
| Linearity | The ability of the procedure (within a given range) to obtain test results which are directly proportional to the concentration (amount) of analyte in the sample. |
| Range | The interval between the upper and lower concentration of analyte (inclusive) for which the procedure has been demonstrated to have a suitable level of precision, accuracy and linearity. |
The three implications of specificity, by test type:
- Identification — establish that the procedure identifies the analyte and does not respond to related structures.
- Purity tests — establish that the procedures allow an accurate statement of the content of impurities (related substances, heavy metals, residual solvents, etc.).
- Assay (content / potency) — establish that the procedure gives a result that allows an accurate statement of the content or potency of the analyte in the sample.
Which characteristics for which test type
The historical Q2 table — still the working mental model — maps characteristics to purpose. + = normally required, – = normally not.
| Characteristic | Identification | Impurities — quantitative | Impurities — limit | Assay / content / dissolution |
|---|---|---|---|---|
| Specificity / selectivity | + | + | + | + |
| Accuracy | – | + | – | + |
| Precision — repeatability | – | + | – | + |
| Precision — intermediate | – | + | – | + |
| Detection limit | – | – | + | – |
| Quantitation limit | – | + | – | – |
| Response / linearity | – | + | – | + |
| Range | – | + | – | + |
Read it as logic, not as a grid to memorize: an identity test only has to be specific; a limit test for an impurity has to detect reliably at the limit but need not quantify; a quantitative impurity method has to do nearly everything an assay does, plus work down at the reporting threshold.
Specificity — “are we measuring the right thing?”
An API peak can look clean, integrate cleanly, and report 99.2 % while a degradation product co-elutes underneath it. The instrument still produces a number; the number may be wrong.
Specificity/selectivity is the evidence that the procedure distinguishes the analyte from everything relevant that could interfere:
- impurities and degradation products
- excipients and process-related materials
- matrix components
- other analytes measured by the same method
This is the hinge back to Q1: Q1 tells us the product may degrade; specificity is what lets the analytical procedure see that degradation correctly. Peak purity by diode-array and LC–MS, resolution from forced-degradation products, and mass balance are the usual evidence.
Accuracy — “are we getting the right answer?”
Accuracy is closeness of the measured result to an accepted reference or true value. Depending on the procedure it is shown with:
- certified reference materials
- spiking / recovery studies (add a known amount of analyte or impurity to the matrix, measure what comes back)
- comparison against an orthogonal procedure
- for an assay, from precision + specificity + response taken together
Spike 0.50 % of an impurity into the product matrix and recover 0.50 % consistently, and you have evidence the method is accurate in that region. But accuracy alone is not enough — a method can be accurate on average while being wildly variable.
Precision — “would I get the same answer again?”
Precision is the variability of repeated measurements, assessed at nested levels:
| Level | What varies | Also called |
|---|---|---|
| Repeatability | Same analyst, same instrument, short interval | Intra-assay precision |
| Intermediate precision | Different days, analysts, instruments — one lab | Within-laboratory reproducibility |
| Reproducibility | Different laboratories | Inter-laboratory (method transfer / pharmacopoeial studies) |
The target picture makes the accuracy/precision distinction concrete — they are independent axes:
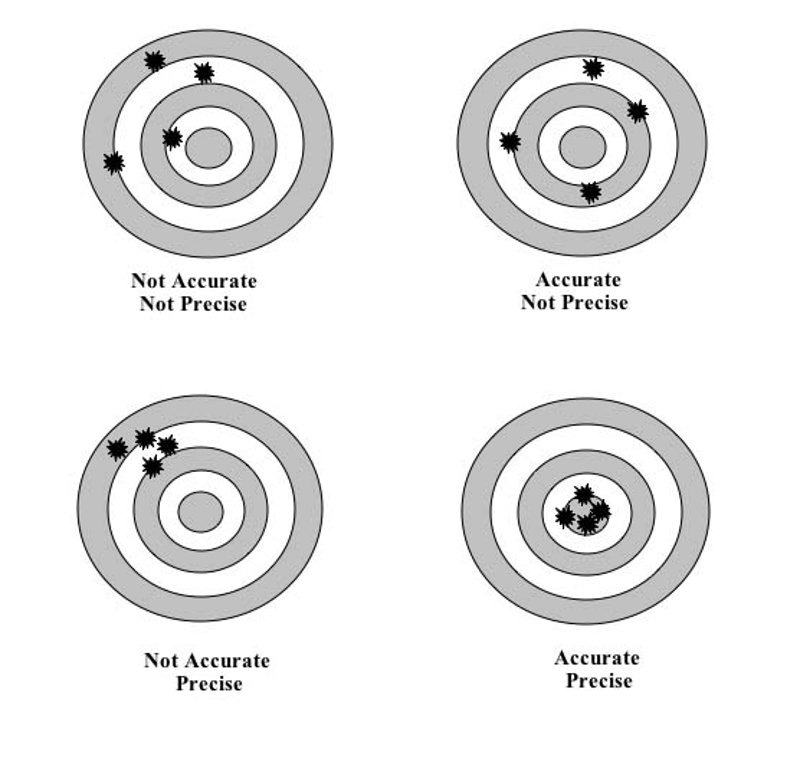
- Not accurate, not precise — shots scattered all over: neither the right answer nor a consistent one.
- Accurate, not precise — shots average on the bullseye but scatter widely: right on average, but any single result could be well off.
- Not accurate, precise — a tight cluster, but off-centre: consistently the wrong answer — the dangerous case, because the low scatter looks reassuring.
- Accurate and precise — a tight cluster on the bullseye. This is the goal.
Accuracy is closeness to the right answer; precision is consistency. You need both, and Q2 asks for them separately.
Range — “where does this method actually work?”
A method is not equally reliable at every concentration. An impurity method intended for 0.05 % → 1.0 % may behave beautifully at 0.5 % and still not be demonstrated at 0.05 %. Validation has to cover the reportable range relevant to the intended use — for an assay typically 80–120 % of nominal, wider for content uniformity, down to the reporting threshold for impurities.
Q2(R2) makes reportable range an explicit concept: the interval over which the procedure has been shown to provide results of acceptable accuracy and precision for the decision it supports, not a generic property of the instrument.
Detection limit vs. quantitation limit
Students routinely conflate these:
| Claim | Typical basis | |
|---|---|---|
| Detection limit | “I can tell something is there.” | Signal-to-noise ≈ 3:1; or from the response SD and slope |
| Quantitation limit | “I can measure how much is there, with acceptable accuracy and precision.” | Signal-to-noise ≈ 10:1; confirmed by accuracy + precision at that level |
Seeing a small peak at 0.01 % does not license reporting Impurity = 0.010 %. The ability to see something and the ability to measure it are different scientific claims, and the QL — not the DL — has to sit at or below the reporting threshold for a quantitative impurity method.
Robustness — “what happens when reality isn’t perfect?”
Real laboratories are not perfectly controlled: mobile-phase preparation varies, column temperature drifts, pH moves, flow rate is never mathematically exact, different analysts prepare samples, different instrument units behave differently. Robustness asks whether the method stays fit for purpose under small, deliberate, reasonable variations in those factors.
This is the connection to Q14 and the enhanced approach:
Robustness is not something you discover accidentally during validation. It is something you should establish during development — ideally by design of experiments — so the method arrives at validation with a known operable region.
A fragile method can pass validation under ideal conditions and then be a nightmare in routine QC.
Precision is not the same as reproducibility
Worth a few minutes with graduate students. Lab A runs the method and gets 99.1, 99.2, 99.1, 99.2 %. Lab B gets 98.9, 99.4, 99.0, 99.3 %. Now transfer the method to five manufacturing sites: if every site produces a slightly different answer, you have a method deployment problem, not necessarily a product problem.
The goal is not “the method worked in the development laboratory.” The goal is “the measurement system stays fit for purpose wherever it is legitimately used” — which is why method transfer and lifecycle management (see Quality Control) matter as much as the original validation.
Stability-indicating methods
This is the deepest link to the Q1 lecture. A stability-indicating procedure must be able to detect and quantify the relevant changes in the product over time. The workflow:
stress the product → generate degradation products → develop the analytical separation → demonstrate specificity against those degradants → evaluate assay + degradants → check mass balance → validate the procedure → deploy it in the stability program
So Q1 and Q2 interlock:
- Q1 — the product changes.
- Q2 — the measurement system can detect and quantify the change.
Q2(R2) specifically addresses demonstration of stability-indicating properties as part of specificity/selectivity.
Validation samples are experiments
A teaching point: don’t say “now we do validation.” Say “now we design experiments that let us make defensible claims about the performance of the measurement system.” For example —
| Claim | The method is accurate across 80–120 % of nominal concentration. |
| Experiment | Prepare samples at known concentrations spanning that range. |
| Evidence | Compare measured results against the accepted values. |
| Conclusion | Decide whether the observed performance supports the claim. |
That is the hypothesis → experiment → data → interpretation → conclusion → revision loop from Section 1, applied to the measurement instead of the molecule.
Statistics are part of analytical science
Q2 is where students should stop seeing statistics as decoration added to a report at the end. Statistics answer: how variable is the method? is an observed difference meaningful? is the response behaving as expected? what range is supported? are results consistent across analysts, days, instruments? how much confidence belongs on the estimate?
Two cautions:
- A statistically significant result is not automatically scientifically important.
- A non-significant result does not prove two things are identical.
The analyst interprets the statistics against the intended analytical purpose — that judgment is the A in STEAM.
Multivariate analytical procedures
Modern analytical science increasingly goes beyond one signal and one concentration — NIR, Raman, chemometrics, multivariate calibration, process analytical technology. Here the result comes from a model, not a single peak, and Q2(R2) adds explicit considerations for these procedures.
The question for students: when the result comes from a model, what exactly are we validating? Not just the instrument, not just the spectrum — the measurement system and the model together, including how the model was trained, how its inputs are controlled, and how it will be maintained as the process and the samples drift.
Platform methods change the equation
If a company already has a well-understood analytical platform and develops another molecule using essentially the same approach, it does not have to start validation from zero. Q2(R2) recognizes that a platform analytical procedure applied to a new purpose can be validated with an abbreviated package when scientifically justified.
The QbD principle underneath: knowledge has value. Accumulated, reliable knowledge about a measurement platform should not be discarded every time a new product enters development.
Validation through the lifecycle
The most important modernization in how Q2 is taught:
| Traditional | Modern (Q2(R2) + Q14) |
|---|---|
| develop → validate → done | develop → understand → validate → deploy → monitor → maintain → improve |
A method can drift. Instruments change, column suppliers change, the formulation changes, the process changes, the impurity profile changes, the specification changes, technology improves. Therefore:
The validated state is not a frozen state.
Validation is evidence that the procedure is fit for purpose at a point in its lifecycle. The procedure then needs monitoring and maintenance — continued performance verification — for the rest of its useful life, and Q2(R2) places that explicitly inside the Q14 lifecycle.
The Q2 → Q14 → QC map
Put this on the board instead of “Q2 is the validation guideline”:
Q14 — how do we develop the analytical procedure?
↓
Q2 — how do we demonstrate it performs as intended?
↓
QC — how do we know it keeps performing?
↓
Lifecycle management (Q12) — what do we do when the world changes?
Q14 builds the scientific understanding; Q2 provides the framework for demonstrating performance; the lifecycle maintains the state of control.
The analytical procedure as a control
A QC result is a decision — pass → release, fail → investigate / reject / hold. The analytical procedure is not merely producing information; it participates in the control strategy. If the measurement is wrong, the decision can be wrong: a false pass releases a defective product; a false fail rejects good product. Behind that decision is a patient.
Analytical validation is ultimately about protecting the quality decision.
The hierarchy of confidence
A useful visual — each layer depends on the ones below it:
| Question | Characteristic |
|---|---|
| Can I see it? | Detection limit |
| Can I measure it? | Quantitation limit |
| Am I measuring the right thing? | Specificity / selectivity |
| Am I getting the right answer? | Accuracy |
| Would I get the same answer again? | Precision |
| Does it work where I need it to? | Reportable range |
| Does it survive reasonable variation? | Robustness |
| Can I defend the result? | Validated analytical procedure |
What Q2 does not mean
Students often take away the wrong impression. Q2 does not mean:
- “Do these nine tests and you’re validated.”
- “Every method needs exactly the same experiments.”
- “A passing validation report proves the method will work forever.”
- “The instrument is qualified, therefore the analytical result is valid.”
Instead: validation is a scientifically justified body of evidence that the analytical procedure is fit for its intended purpose. That distinction is the heart of Q2(R2).
Where the analyst sits
Every number in a development or QC report ultimately rests on a measurement. The analyst is not asking “what number did the instrument produce?” but “what does this number mean, and what evidence lets me trust it?” — which draws on chemistry, instrumentation, statistics, experimental design, risk assessment, judgment, documentation, and scientific integrity at once. That is STEAM in action.
If the Q1 lesson is a shelf life is a hypothesis that must survive testing, the Q2 lesson is a measurement is a claim that must earn our trust — and together they run the sequence the course follows: science → Q1 stability → Q2 validation → Q3 impurities → Q6 specifications → Q8–Q14 quality by design. The thread is not memorizing guidelines; it is answering how do we know? and then how do we know that we know?
For discussion
- An assay reports 99.2 % and the chromatogram looks clean. What specific evidence would convince you a degradation product is not hiding under the main peak?
- An impurity method has a quantitation limit of 0.08 % and a reporting threshold of 0.05 %. Is the method fit for purpose? What are the options?
- You validated a method in the development lab; two manufacturing sites now get results that differ by 1.5 %. Is this a product problem, a method problem, or a transfer problem — and what data tells you which?
- Your company has a platform HPLC assay used on six prior molecules. A regulator asks why the validation package for molecule seven is abbreviated. What is the scientific justification, and where are its limits?
- A NIR method predicts assay from a chemometric model. List everything that is “the measurement system” here, and say what you would monitor over the method’s life.
- Forced degradation (from the Q1 workflow) produces a degradant at 80 °C that never appears at 25 °C. Does your method need to resolve it? Does it belong in the specificity package?
- A validation result is statistically significant but the effect is 0.2 % of nominal. A different result is non-significant with a 3 % spread. Which one worries you, and why?
Source note. ICH Q2(R2) Validation of Analytical Procedures reached Step 4 on 1 November 2023 and is the current guideline; a minor error-correction version was issued in 2025. Its stated objective is to demonstrate that an analytical procedure is fit for its intended purpose, and it is explicitly harmonized with Q14 and the analytical-procedure lifecycle. Primary texts: the ICH Q2(R2) guideline (2023) and the 2025 error-correction version. (Instructor: confirm the current characteristic-by-test-type table against the R2 text before lecture — the guideline reframes linearity/range as response and reportable range.)