Quality Risk Management — How Much Evidence Is Enough
ICH Q9(R1) as a loop, not a form: the risk-management toolbox (FMEA, FTA, HACCP, HAZOP, risk ranking and filtering, Ishikawa/PHA), FMEA in action, and how a risk assessment becomes a control strategy — worked through the nitrosamine risk assessments.
The one idea
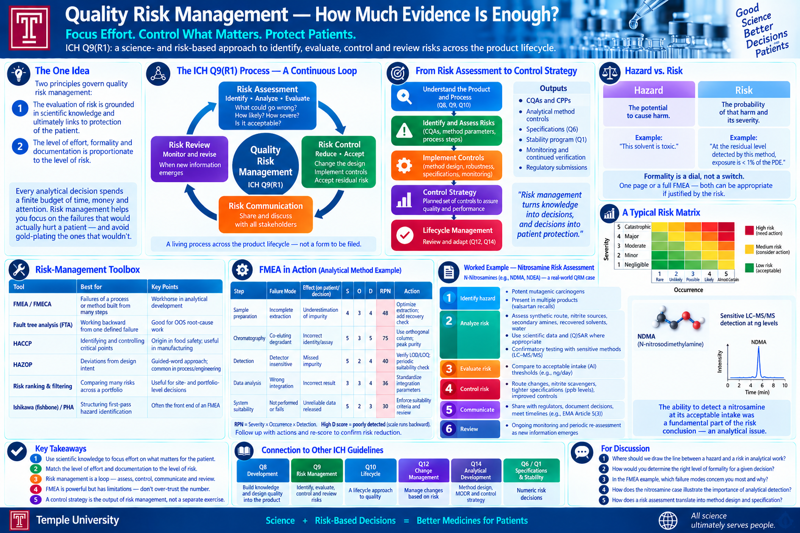
Two principles govern quality risk management: the evaluation of risk is grounded in scientific knowledge and ultimately links to protection of the patient; and the level of effort, formality, and documentation is proportionate to the level of risk.
Every analytical decision spends a finite budget of time, money, and attention. Risk management is how you point that budget at the failures that would actually hurt a patient, and stop gold-plating the ones that wouldn’t. It is the machinery behind “scientifically justified” — the phrase that appears in almost every ICH guideline and is doing a lot of quiet work.
The ICH Q9 framework
ICH Q9(R1) — Quality Risk Management (the R1 revision, adopted 2023, added guidance on subjectivity, the hazard-versus-risk distinction, formality, and risk-based decision-making). The process is a loop, not a form:
Stage
What happens
Analytical example
Risk assessment — identification
What could go wrong?
A co-eluting degradant is not resolved from the API
Risk assessment — analysis
How likely, how severe, how detectable?
Estimate occurrence from forced-degradation data; severity from the degradant’s qualification threshold; detection from method specificity
Risk assessment — evaluation
Is that acceptable against defined criteria?
Compare against a risk threshold agreed before the assessment
Risk control — reduction
Change the design to lower likelihood or raise detection
Switch to an orthogonal column; add a peak-purity check
Risk control — acceptance
Some residual risk is accepted, explicitly and on the record
Document the residual and the justification
Risk communication
The assessment and decisions are shared with everyone who acts on them
The control strategy, the filing, the SOP
Risk review
Revisit when something changes
A new impurity at month 9 of stability reopens the assessment
Two ideas from Q9(R1) matter for the analyst:
Hazard is not risk. A hazard is the potential to cause harm; risk combines the probability of that harm with its severity. “This solvent is toxic” is a hazard statement; “at the residual level this method can detect, the exposure is X% of the PDE” is a risk statement.
Formality is a dial, not a switch. A one-line rationale, a risk-ranking table, and a full cross-functional FMEA are all valid quality risk management — the guideline asks you to match the formality to what is at stake, and to say why.
The toolbox
Each tool below gets its own full walkthrough — mechanics, a worked analytical example, and where it breaks down:
Failure Mode and Effects Analysis decomposes a method or process into steps, and for each step asks: what could fail (failure mode), what would that do (effect), why would it happen (cause), and how would we catch it (controls). Each mode is scored:
Risk Priority Number = Severity × Occurrence × Detection
Severity — how bad the effect is for the patient or the decision (a wrong release decision scores high; a re-run scores low).
Occurrence — how often the cause is expected to produce the failure.
Detection — how likely the existing controls are to catch it before it matters. High detection score = poorly detected — this scale runs backward, and it is where most FMEAs go wrong.
Modes with a high RPN, or a high severity regardless of RPN, get an action; then the mode is re-scored to show the action worked. The number is easy to game and easy to over-trust — see the full FMEA walkthrough for a worked multi-failure-mode example and the known weaknesses worth teaching so students don’t over-trust it.
From risk assessment to control strategy
A control strategy is the planned set of controls — derived from current product and process understanding — that assures performance and quality. It is the output of risk management, not a separate exercise:
Attribute risk assessment decides which quality attributes are critical (CQAs) and therefore need a specification and a method.
Method risk assessment (an FMEA against the analytical target profile) decides which method parameters need to be controlled, and how tightly — this is where a robustness study is a risk-control activity, not a validation checkbox.
The specification (Q6) and the stability program (Q1) are risk decisions in numeric form.
Worked example — nitrosamine risk assessments. Between 2018 and 2023 every marketing authorization holder had to assess every product for the risk of N-nitrosamine impurities (NDMA, NDEA, and drug-specific nitrosamines), triggered by the valsartan recalls. The assessment is a textbook QRM: identify the hazard (potent mutagenic carcinogens), analyze the risk (synthetic route, nitrite sources, secondary amines, recovered solvents, water; then confirmatory testing), control it (route changes, nitrite scavengers, tightened limits at ppb levels), and communicate it (to the agency, on a deadline). It also shows the analyst’s exposure directly: the risk conclusion depended entirely on whether a method existed that could see a nitrosamine at its acceptable intake — a detection problem.
Source note. Risk management is anchored in ICH Q9(R1), with ICH Q8(R2), Q10, and Q14. FMEA methodology follows IEC 60812 and the AIAG-VDA FMEA handbook. The nitrosamine case follows the EMA/FDA guidance and Article 5(3) referral outcomes. (Instructor: confirm the Q9(R1) adoption date and current EMA nitrosamine guidance revision.)
Failure Mode and Effects Analysis worked end to end on an HPLC assay method: the RPN formula, a full failure-mode table with a before/after action, why detection runs backward, and the known weaknesses that make RPN easy to over-trust.
FTA starts from a failure that already happened and works backward through AND/OR logic to its contributing causes — the standard tool for an OOS root-cause investigation, and the mirror image of FMEA’s forward-looking approach.
Hazard Analysis and Critical Control Points asks a narrower question than FMEA: not every failure mode in a process, but where the few points are whose failure directly threatens the patient — worked through a sterile-fill bioburden-control example.
Hazard and Operability study asks, guided word by guided word, what happens if a process parameter is too much, too little, reversed, or accompanied by something unintended — a process/engineering tool applied here to a chromatography example.
When risks come from different processes, products, or sites and don’t share a common scale, risk ranking and filtering normalizes them against weighted criteria to build one prioritized list — worked through a site quality council’s quarterly resourcing decision.
Before an FMEA can score failure modes, it needs a reasonably complete list of them — fishbone diagrams and Preliminary Hazard Analysis are how that list gets brainstormed systematically, worked through an unexpected-peak example that feeds directly into an FMEA.