FMEA in Detail — Scoring, Scaling, and Where It Breaks
The one idea
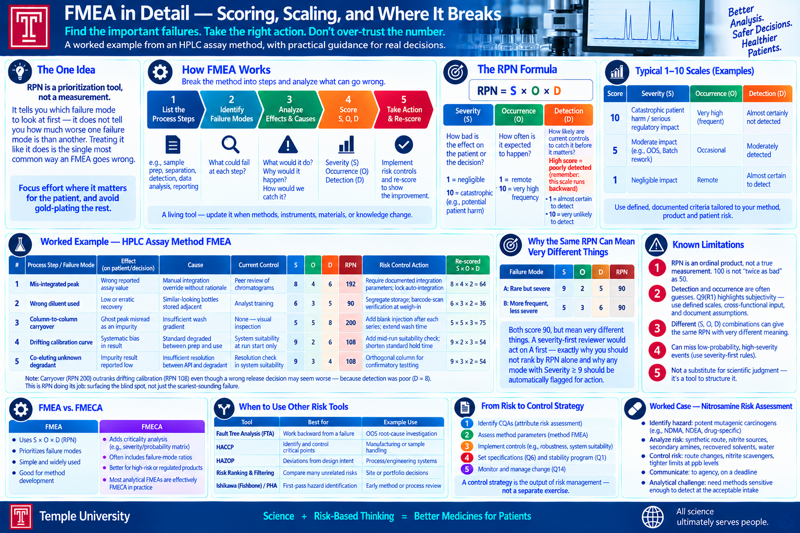
RPN is a prioritization tool, not a measurement. It tells you which failure mode to look at first — it does not tell you how much worse one failure mode is than another, and treating it like it does is the single most common way an FMEA goes wrong.
Mechanics
Failure Mode and Effects Analysis decomposes a method or process into steps, and for each step asks: what could fail (failure mode), what would that do (effect), why would it happen (cause), and how would we catch it (controls)? Each mode is scored on three independent 1–10 scales and multiplied:
Risk Priority Number = Severity × Occurrence × Detection
- Severity — how bad the effect is for the patient or the decision. A wrong release decision (a failing batch shipped, or a good batch scrapped) scores high; a re-run that costs a day scores low.
- Occurrence — how often the cause is expected to produce the failure, from historical data or, absent that, engineering judgment.
- Detection — how likely the existing controls are to catch the failure before it matters. High detection score = poorly detected — this scale runs backward from the other two, and it is where most FMEAs go wrong: a “10” means “we would almost certainly miss this,” not “we’d definitely catch it.”
Modes with a high RPN, or a high severity regardless of RPN, get a corrective action; the mode is then re-scored to show the action actually moved the number, not just noted “action taken.”
Worked example — an HPLC assay method
| Failure mode | Effect | Cause | Current control | S | O | D | RPN | Action | Re-scored RPN |
|---|---|---|---|---|---|---|---|---|---|
| Mis-integrated peak | Wrong reported assay value | Manual integration override without documented rationale | Peer review of chromatograms | 8 | 4 | 6 | 192 | Require documented integration parameters; lock auto-integration settings | 8 × 4 × 2 = 64 |
| Wrong diluent used | Low or erratic recovery | Similar-looking bottles stored adjacent on the bench | Analyst training | 6 | 3 | 5 | 90 | Segregate diluent storage; barcode-scan verification at weigh-in | 6 × 3 × 2 = 36 |
| Column-to-column carryover | Ghost peak misread as an impurity | Insufficient wash gradient between injections | None — relies on visual inspection | 5 | 5 | 8 | 200 | Add a blank injection after each sample series; extend wash time | 5 × 5 × 3 = 75 |
| Drifting calibration curve | Systematic bias in reported result | Standard degraded between preparation and use | System suitability at run start only | 9 | 2 | 6 | 108 | Add a mid-run suitability check; shorten standard hold time | 9 × 2 × 3 = 54 |
| Co-eluting unknown degradant | Impurity result reported low | Insufficient resolution between API and degradant | Resolution check in system suitability | 9 | 3 | 4 | 108 | Switch to an orthogonal column for confirmatory testing | 9 × 3 × 2 = 54 |
Two things worth noticing in this table: the carryover mode (RPN 200) outranks the drifting-calibration mode (RPN 108) even though a wrong release decision from a drifting curve is arguably worse — because carryover’s detection score was so bad (8: nobody was actually looking for it). That is RPN doing its job: surfacing the blind spot, not just the scariest-sounding failure.
Why the same RPN can mean very different things
| Failure mode | S | O | D | RPN |
|---|---|---|---|---|
| A | 9 | 2 | 5 | 90 |
| B | 5 | 3 | 6 | 90 |
Both score 90. Mode A is a rare but severe failure that’s moderately well detected; mode B is a more frequent, less severe failure that’s poorly detected. A severity-first reviewer would act on A first regardless of the tied RPN — which is exactly the argument for not ranking a whole FMEA by RPN alone, and for flagging any mode with severity ≥ 9 for action independent of its RPN.
FMEA vs. FMECA
FMECA adds a formal criticality analysis on top of FMEA — instead of (or alongside) the RPN product, each failure mode’s criticality is assessed against a defined severity/probability matrix, often with failure-mode ratios when one cause can produce several distinct failure modes. In practice, most analytical-development FMEAs are really FMECAs in miniature: teams already flag “any severity ≥ 9 regardless of RPN” as an action trigger, which is a criticality rule, not a pure RPN rule.
Known weaknesses — worth teaching so students don’t over-trust the number
- RPN is an ordinal product treated as if it were interval data; an RPN of 100 is not “twice as bad” as 50, and — as shown above — different (S, O, D) triples give the same RPN with very different meaning.
- Detection and occurrence are often guessed. Q9(R1) explicitly flags this subjectivity and asks for it to be managed (defined scales, cross-functional scoring, documented assumptions).
- Many programs now supplement or replace RPN with a severity-first criticality matrix, or with risk ranking and filtering when comparing failure modes across unrelated processes.
When to reach for something else
FMEA decomposes one process step by step and scores every mode on the same three scales — it’s the right tool when the process is defined and you’re building or revising its control strategy. Reach for fault tree analysis instead when you’re working backward from a failure that has already happened and need to trace its root cause; reach for risk ranking and filtering when you’re comparing risks that don’t share a process or a scale at all.