Lab Automation and Process Analytical Technology — Moving the Measurement to the Line
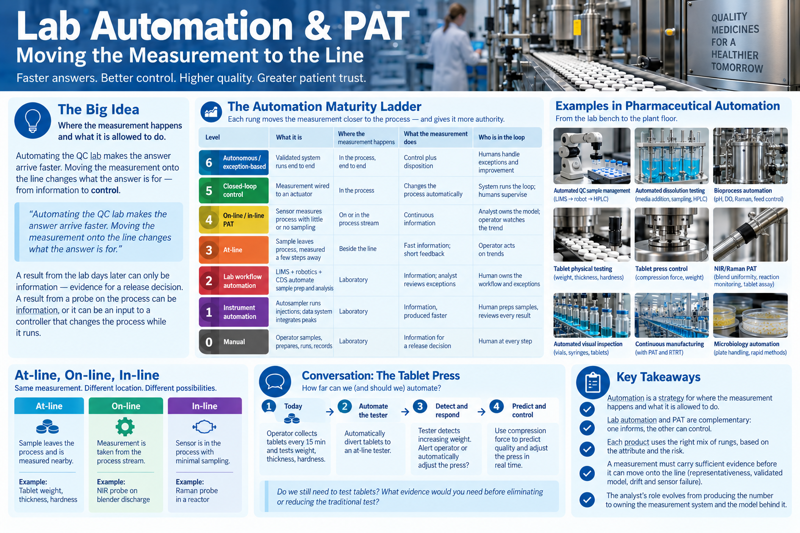
The Quality Control section described QC as the function that demonstrates control on every batch — and, traditionally, it does that by pulling a sample and carrying it to a laboratory. This section is about what happens when the measurement stops travelling to the lab: when it moves next to the process, then onto it, and finally into the control loop that runs it.
The one idea
Lab automation is usually pitched as a set of technologies — robots, LIMS, NIR probes, machine vision. That framing hides the more useful question, which is about where the measurement happens and what the measurement is allowed to do:
Automating the QC lab makes the answer arrive faster. Moving the measurement onto the line changes what the answer is for.
A result that comes back from the lab two days later can only be information — evidence for a release decision. A result that comes from a probe in the powder stream can be information, or it can be an input to a controller that changes the process while it runs. The interesting transitions in this section are the ones where a measurement crosses from one role to the other.
The automation maturity ladder
Rather than a dozen unrelated technologies, read pharmaceutical measurement as a ladder. Each rung moves the measurement closer to the process and gives it more authority.
| Level | What it is | Where the measurement happens | What the measurement does | Who is in the loop |
|---|---|---|---|---|
| 0 — Manual | Operator samples, prepares, runs the instrument, reads and records the result | Laboratory | Information for a release decision | Human at every step |
| 1 — Instrument automation | Autosampler runs 100 injections overnight; the data system integrates the peaks | Laboratory | Information, produced faster | Human preps samples, reviews every result |
| 2 — Lab workflow automation | LIMS raises the test request, a robot retrieves and prepares the sample, the CDS processes the run, results flow back and are checked against the specification | Laboratory | Information; the analyst reviews exceptions, not every result | Human owns the workflow and the exceptions |
| 3 — At-line | The sample leaves the process but is measured a few steps away — a tablet comes off the press and is automatically tested for weight, thickness, hardness | Beside the line | Fast information; short feedback to the operator | Operator acts on trends |
| 4 — On-line / in-line PAT | A sensor measures the process with little or no sampling — an NIR probe on the blender, a Raman probe in the reactor | On or in the process stream | Continuous information about the process state | Analyst owns the model; operator watches the trend |
| 5 — Closed-loop control | The measurement is wired to an actuator — the press adjusts fill depth from a weight signal; a reactor feed is trimmed from a Raman reading | In the process | Control — it changes the process automatically | System runs the loop; humans supervise |
| 6 — Autonomous / exception-based | A validated system holds the process inside its control strategy and diverts non-conforming material on its own; people investigate deviations | In the process, end to end | Control plus disposition | Humans handle exceptions and improvement |
The rungs are not a maturity contest. A single product routinely sits on several at once — an at-line hardness tester, an in-line NIR blend monitor, and a manual dissolution test in the lab — one rung per attribute, chosen by what the attribute is worth and how well it can be measured where you want to measure it.
At-line, on-line, in-line
The three middle rungs turn on a vocabulary worth fixing precisely (the terms come from PAT practice and ASTM E2363):
| Term | Where the sample is | Latency | Example |
|---|---|---|---|
| At-line | Removed from the process, measured close by | Seconds to minutes | Tablets diverted from the press to an automated weight / hardness tester |
| On-line | Diverted into a fast measurement loop, often returned to the stream | Seconds | A slipstream through a flow cell on a chromatography skid |
| In-line | Not removed at all — the probe sits in the stream | Real time | An NIR or Raman probe through the wall of a blender or reactor |
Each step tightens the link between measurement and process and removes a place where the sample can change, be swapped, or be lost. It also moves variability into the measurement system — the analytical procedure is a measurement system, and an in-line probe adds the process environment, the probe window, and a calibration model to the list of things that can move the number.
A worked example: the tablet press
One scenario carries most of the ideas in this section.
Every 15 minutes an operator collects 10 tablets from a running press, carries them to an at-line tester, and measures weight, thickness, and hardness. The results are typed into a batch record. If a value drifts, the operator adjusts the press.
Conversation 1 — what could we automate? The quick answer is “the tester.” Push further. Why collect the tablets by hand? Why every 15 minutes and not continuously? Why 10 and not 3, or 100? Why does a person transcribe a number a machine already produced? Each “why” is a design decision that was made once and rarely revisited.
Conversation 2 — divert the tablets automatically. Now the press feeds tablets straight into the tester on a schedule. Nothing about the measurement changed, but the quality system did: the sampling is now defined by equipment, the data path is electronic end to end, and the record is created without a human hand. What has to be qualified that wasn’t before?
Conversation 3 — the tester sees weight rising. It is trending toward the upper limit. Should it raise an alarm for the operator, or adjust the press’s fill depth itself? The moment the measurement is allowed to move an actuator, it has stopped being a test and become a control — and the validation, the failure modes, and the regulatory description all change.
Conversation 4 — the press predicts tablet properties from compression force. The press already measures compression force on every tablet; a model turns that into a predicted weight and hardness, continuously, for 100 % of the batch. Do we still need to physically test tablets? How many? What evidence would you want before reducing or removing the at-line test — and what stays on the specification regardless?
That single example reaches automation, PAT, sampling theory, control strategy, model validation, process capability, data integrity, and real-time release — without opening with a regulation.
Where did the QC lab go?
Set the same product in 1985: manufacture the batch → pull samples → send them to QC → test → wait → release. Every critical quality attribute is measured once, at the end, on a few units, days after the material was made.
Now walk the measurement toward the process:
Lab → At-line → On-line → In-line → Feedback control → Real-time release
At the end of that walk the finished-product test is gone, replaced by a validated in-process measurement plus a process model — real-time release testing (RTRT). The provocative version of the question:
If we can measure the critical quality attribute continuously while we manufacture the product, why are we taking thirty tablets to a laboratory afterward to prove what we already know?
The answer is not simply “we shouldn’t.” That question is where the interesting pharmaceutical-quality discussion starts: measurement uncertainty, sample representativeness, whether the model is validated across the range the process will actually explore, what happens when a sensor fails, calibration and model drift, the depth of process understanding behind the model, the commitments already written into the filing, and the difference between a specification limit and a control limit.
A catalogue of pharmaceutical examples
Each of these is a conversation of its own — the same push from “automate the test” toward “does the test still need to exist.”
| Example | What is automated | Rung it reaches | The question it raises |
|---|---|---|---|
| QC sample management | LIMS raises the request → robot retrieves the sample → automated dilution and prep → HPLC / UPLC → CDS processes chromatograms → results to LIMS → spec check | 2 | If the analyst only reviews exceptions, what makes an exception — and who validated that logic? |
| Dissolution testing | Automated media prep, tablet loading, timed sampling, filtration, HPLC / UV read, profile calculation | 2 | What in this test still needs human judgement, and why? |
| Content uniformity / assay | Robotic tablet handling and sample prep into HPLC or spectroscopy | 2 | Robotics, instrument integration, data integrity and method validation at once |
| Microbiology | Automated plate handling and colony counting, rapid microbial methods, automated incubation and environmental monitoring | 2–4 | A different automation problem from a chemistry lab — slow, biological, contamination-sensitive |
| Tablet physical testing | Tablets sampled from the press and measured for weight, thickness, diameter, hardness | 3 | Connect the results back to press settings — the bridge from QC to manufacturing |
| Tablet weight control | The press measures a compression / weight signal every tablet and trims fill depth | 5 | Is this testing, monitoring, or control? |
| NIR blend uniformity | An in-line NIR probe monitors the blender instead of thief sampling plus a lab assay | 4 | Can the PAT measurement eventually replace the traditional test? |
| NIR tablet assay / CU | Rapid spectral measurement of tablets, at-line or on-line | 3–4 | Chemometrics, model maintenance, the reference method, lifecycle management |
| Continuous manufacturing | Feeders → blender → press → PAT → automated diversion when the process leaves its control strategy | 5–6 | The full Q13 picture — and real-time release |
| Reaction monitoring | In-line Raman or NIR follows reaction progress and calls the endpoint, instead of a sample to the lab every 30 minutes | 4 | Mostly a drug-substance problem — endpoint by spectroscopy |
| Bioprocess control | pH, dissolved oxygen, temperature and feed control, plus Raman for glucose, lactate, and metabolites | 5 | Feedback and feed-forward control of a living system |
| Visual inspection | Camera systems inspect vials, syringes or tablets for particles, cracks, fill level, stopper position | 3–6 | Machine vision and AI — and the problem of validating an algorithm |
What has to be true before the test can move
Moving a measurement down the ladder is not free. Before an in-process measurement can reduce or replace a lab test, the evidence has to carry more weight, not less:
- Representativeness. A probe sees a small, fixed volume of a moving stream. Does that volume represent the batch the way a thief sample or a composite does?
- A validated model, not just an instrument. An NIR or Raman result is a model over a spectrum, and the thing being validated is the measurement system and the model together — how it was calibrated, how the calibration set spans the expected variation, how predictions are checked against a reference method.
- A model lifecycle. Feed material drifts, the process ages, the probe window fouls. The model needs monitoring, a recalibration trigger, and a managed-change path — the analytical procedure lifecycle Q14 describes, with a method operable design region and established conditions deciding what counts as a reportable change.
- Failure modes. What does the system do when the sensor fails, the model flags an outlier, or the process moves outside the calibration range? A lab test that cannot run just delays release; a control loop that misreads can move the process the wrong way.
- Process understanding. RTRT rests on a demonstrated link from process parameters to the quality attribute — the design space and control strategy from Q8. The measurement is only half the argument.
- Specification vs. control limits. The specification limit does not move when the measurement does — the attribute and its acceptance criterion stay on the filing. What changes is where and when it is measured, and the validation burden goes up to match.
Where the analyst sits
On the manual rung the analyst runs the sample. By the middle of the ladder the analyst reviews exceptions instead of results. By the top, the analyst does not run anything routine — they own the model and the monitoring: the calibration, the reference-method correlation, the drift limits, the revalidation after a raw-material change, and the answer to “why should we believe this number” when no one pulled a sample.
If the Q2 lesson is a measurement is a claim that must earn trust, and the Quality Control lesson is quality is assured by accumulated knowledge, not produced by the final test, the automation lesson is: when the measurement moves onto the line, the analyst moves with it — from producing the number to owning the system and the model that produce it, and proving both stay fit for purpose while the process drifts underneath them. Section 1 called a method a hypothesis about a molecule; on an in-line probe that hypothesis is being tested a thousand times an hour, and someone has to be accountable for it. That is the A in STEAM again.
For discussion
- The tablet tester detects rising weight. Should it alert an operator or adjust the press itself? Name exactly what changes in the quality system the moment a measurement is allowed to move an actuator.
- A line runs in-line NIR content uniformity and predicts every tablet. What evidence would you need before you stop pulling 30 tablets for the lab test — and what stays on the specification either way?
- Classify each as testing, monitoring, or control, and name the quality-system obligation each carries: an at-line hardness tester; a press that trends compression force; a press that adjusts fill depth from that force.
- Why every 15 minutes? Why 10 tablets? Why does a person transcribe the result? Take one manual QC step you know and push on every part of it.
- The NIR model that has run your blend-uniformity release for two years starts drifting against the reference HPLC. Walk through what you do — and whether that is a reportable change under Q14 / Q12.
- Automated microbiology — plate handling, rapid methods, environmental monitoring — is a harder automation problem than an automated chemistry lab. Why?
- An in-line Raman endpoint says a reaction is complete; the analyst’s HPLC 30 minutes later disagrees by a hair. Which do you believe, and what would you have had to establish beforehand to answer that quickly?
- Pick one row from the catalogue above and write the four-step “tablet press” conversation for it.
Source note. This section is a teaching framing rather than a single guideline. Its anchors: the FDA’s PAT guidance (PAT — A Framework for Innovative Pharmaceutical Development, Manufacturing, and Quality Assurance, 2004), which introduced the at-line / on-line / in-line vocabulary and the “process understanding” argument; ASTM E2363 for the PAT terminology; and the ICH pages this course already covers — Q8–Q12 (design space, control strategy, established conditions), Q13 (real-time release testing, diversion), Q14 (analytical QbD, the method operable design region, model lifecycle), and Q2(R2) (multivariate procedures). (Instructor: confirm the current status of the FDA PAT guidance, and note that “real-time release testing” is the current ICH term, not “real-time release” or “parametric release”; the maturity-ladder levels here are a teaching device, not a standard scheme.)