The Cost of Development — and Why It Ends Up in the Price of the Drug
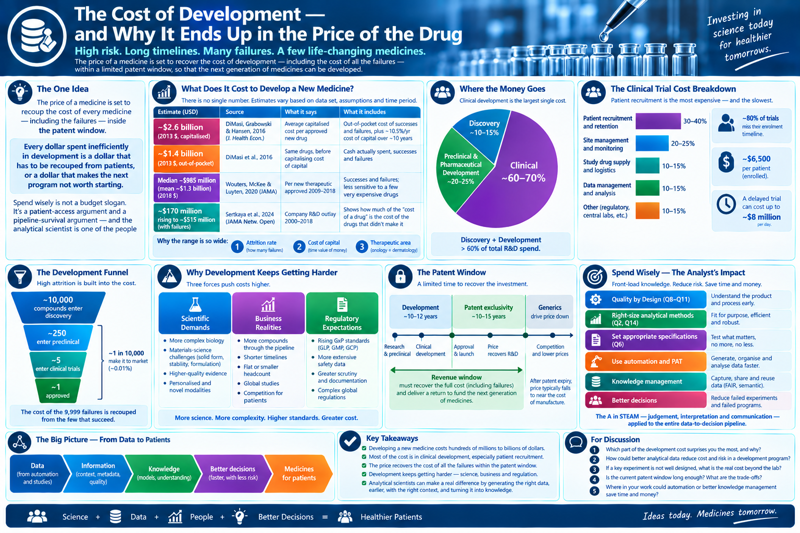
The knowledge management section ended with the analyst owning a data estate and the models built on it. This section asks the question that sits underneath every other decision in the course and rarely gets said out loud: all of this costs money, someone has to pay it back, and the way it gets paid back is the price on the box.
The one idea
A medicine is priced, during the years it is protected by patent, to recover the cost of developing it — and the cost of every candidate that failed along the way, and the cost of capital tied up for a decade while none of it earned anything. After the patent expires, generic competition collapses the price toward the cost of manufacture, which for most small molecules is small. So the entire economic argument for a new drug has to close inside a window of roughly ten to fifteen years of market exclusivity.
Every dollar spent inefficiently in development is a dollar that has to be recouped from patients, or a dollar that makes the next program not worth starting.
That is why “spend wisely” is not a budget slogan. It is a patient-access argument and a pipeline-survival argument at the same time — and the analytical scientist, who designs experiments and sets the evidence bar, is one of the people spending the money.
What a new medicine costs to develop
There is no single number, and the honest thing to teach is the range and why it is so wide.
| Estimate | Source | What it says | What it includes |
|---|---|---|---|
| ~$2.6 billion (2013 $, capitalised) | DiMasi, Grabowski & Hansen, J. Health Econ. 2016 (Tufts CSDD) | Average capitalised cost per approved new drug | Out-of-pocket cost of successes and failures, plus ~10.5 %/yr cost of capital over ~10 years |
| ~$1.4 billion (2013 $, out-of-pocket) | Same study | The same drugs, before capitalising the cost of capital | Cash actually spent, successes and failures |
| Median ~$985 million, mean ~$1.3 billion (2018 $) | Wouters, McKee & Luyten, JAMA 2020 | Per new therapeutic approved 2009–2018, from public filings | Successes and failures; less sensitive to a few very expensive drugs |
| ~$170 million per drug, rising to ~$515 million with failures folded in | Sertkaya et al., JAMA Netw. Open 2024 | Company R&D outlay 2000–2018 | Shows how much of the “cost of a drug” is the cost of the drugs that didn’t make it |
Three things drive the spread: attrition (how many failures each success has to carry), the cost of capital (whether you charge the program for the decade its money was locked up), and therapeutic area (an oncology program and a dermatology program are not the same bet). Whichever figure you use, two features are stable — most of the number is clinical, and a large fraction of it is failure.
Where the money goes
Split the R&D spend by activity and the shape is consistent across studies:
| Bucket | Roughly what share | What it buys |
|---|---|---|
| Discovery | ~10–20 % | Target, hit, lead, candidate selection — a molecule with an established biological lead |
| Preclinical / pharmaceutical development | ~15–30 % | Toxicology, the “materials-science” work — salt and solid-form selection, stability, formulation, process, analytical methods |
| Clinical development | ~35–65 % (largest single bucket) | Phase I–III trials: sites, investigators, patients, monitoring, data management, drug supply |
The teaching deck this section is built on puts it as discovery and development together accounting for over 60 % of the spend, with clinical affairs alone around a third to a half of the total R&D budget. The exact percentages move with how you draw the lines — but the message is the one to keep: the expensive part is not inventing the molecule, it is proving it works and is safe, and getting it into a form that survives a supply chain.
Why clinical development dominates — and why recruitment is the worst of it
Inside a clinical trial, the costs stack up roughly like this: study sites and per-patient payments, patient recruitment and retention, clinical monitoring, data management, regulatory and safety reporting, and drug supply. Per-patient costs run from tens of thousands of dollars in Phase I to well over $40,000 in a large Phase III, and a single pivotal trial can cost $100–300 million.
Patient recruitment consumes more time and more money than any other single activity in a trial. The numbers usually quoted:
- Around 80 % of trials fail to meet their original enrolment timeline; recruitment is the leading cause of trial delay.
- The average cost to enrol one participant is on the order of $6,500, and replacing a drop-out can cost several times that.
- A day of delay to a launch is worth anywhere from roughly $0.6 million to $8 million in lost patent-protected sales, depending on the drug — which means the hidden cost of slow recruitment usually dwarfs the direct cost.
Two operational consequences follow, and both are places where analysis and data feed the economics:
- Budgeting and performance assessment. Recruitment is not a line you set once. Enrolment rate, screen-fail rate, and site productivity should be read while the trial runs and fed straight into mid-trial decisions — reallocate to the sites that are working, open new ones, close dead ones, or stop early. A trial that reports its recruitment metrics only at the end has wasted the information.
- Clinical operations structure and workflow. How the trial is organised — central vs. site-based tasks, monitoring model, how data flows from the clinic to the database, how the drug supply is planned — determines whether those mid-trial decisions can actually be made in time. This is the same deployment problem the Quality Control section raised for methods, seen at trial scale.
The cost of failure is the point, not a footnote
Roughly one in ten molecules that enters Phase I ever reaches the market; in oncology it is closer to one in twenty. Every approved drug is therefore paying for something like nine to nineteen that failed — often after a Phase II or Phase III that cost hundreds of millions. When a study says a drug “cost $2.6 billion,” most of that figure is not the drug on the box; it is the graveyard behind it, plus interest.
This is the direct link back to clinical development as the removal of uncertainty: the cheapest failure is the early one. Anything that kills a bad molecule in preclinical or Phase I instead of Phase III — better toxicology, a sharper biomarker, a cleaner exposure–response argument — moves cost out of the most expensive bucket. Analysis that retires uncertainty early is analysis that saves the most money.
Why development keeps getting harder
The pressure on development comes from three directions at once, and they pull against each other.
Scientific demands — development is a materials-science problem
Discovery hands over a biological lead: a molecule that hits the target. Development then has to turn that molecule into something that can be made at tonne scale, stored for two years, shipped through a hot warehouse, and dissolved reproducibly in a patient. That is a materials-science problem — and it is where the analytical work concentrates:
- Solid-state form — which salt, which polymorph, crystalline vs. amorphous. The form sets solubility, dissolution, stability, and whether the powder can even be compressed.
- Stability — chemical and physical degradation over the product’s shelf life, under real and stressed conditions (ICH Q1).
- Formulation and process — getting a reproducible, manufacturable drug product with the right exposure.
The cautionary tale is ritonavir: an unexpected, more stable polymorph appeared after launch in 1998, the marketed capsule could no longer be made, and the product had to be pulled and reformulated at enormous cost. The form work that would have found it was cheap; finding it in the market was not.
Business realities
- More compounds pushed into development to feed the pipeline.
- Shorter timelines — every month of delay is patent-protected revenue lost.
- Flat or shrinking headcount — the same or fewer scientists absorbing the extra throughput.
More work, less time, no more people. That arithmetic only closes through better methods, automation, and reuse of knowledge — which is the entire case made in the lab automation and PAT and knowledge management sections.
Regulatory compliance and expectations
All of it has to be done under GxP — Good Laboratory Practice for the safety studies, Good Manufacturing Practice for anything a human will take, Good Clinical Practice for the trials. GxP is not optional overhead; it is what makes the data usable in a filing. But the expectation keeps rising — more characterisation, tighter data integrity, lifecycle thinking (Q8–Q12, Q14) — and every increment has a cost that lands in the same budget.
What “spend wisely” asks of the analyst
Put the three pressures together and the response is not “work harder.” It is the set of ideas this course has been building:
- Front-load knowledge. Quality by design (Q8–Q12): understand the molecule, the form, and the process early, when experiments are cheap, so late-stage rework and post-approval investigations don’t happen. The ritonavir money was spent in the wrong phase.
- Right-size the method and the specification. A phase-appropriate method: fit for the decision in front of you, not gold-plated for a decision three years away. A specification justified by data, not by reflex tightening — every unjustified limit is a future batch failure and an investigation.
- Automate the repetitive, model the rest. Move the measurement toward the line where it pays to (Section 6); spend the freed time on the experiments that actually retire uncertainty.
- Capture knowledge so it is reused, not regenerated (Section 7). Re-running an experiment because the first result wasn’t recorded properly is pure waste.
- Kill bad molecules early. The most valuable analytical result is often the one that ends a program in Phase I instead of Phase III.
We all must do our share to spend wisely — because the money is not abstract. It is recouped from patients, or it is the reason the next program doesn’t get funded.
Where the analyst sits
The Q2 lesson was a measurement is a claim that must earn trust. This section adds the constraint that trust is not free: every measurement has a cost, a duration, and an opportunity cost, and the analytical scientist is the person who decides how much evidence is enough for the decision at hand. Judging “is this result worth what it cost, and is the remaining uncertainty acceptable for this decision?” — rather than reflexively generating more data — is the A in STEAM again: judgement and design, now applied to the budget. Section 1 called a method a hypothesis about a molecule; this section adds that a hypothesis test costs money, and a good scientist designs the cheapest test that still answers the question.
For discussion
- A drug is quoted at “$2.6 billion to develop.” Break that number down for a non-scientist: how much is the molecule itself, how much is failures, how much is the cost of capital?
- Your Phase III is enrolling at 60 % of plan at the halfway point. What analytical or clinical data would you want in front of you to decide between adding sites, changing the protocol, and stopping?
- Give an example of an analytical activity that is cheap in early development and ruinously expensive if deferred to post-approval. What would you have done differently?
- “The most valuable result is the one that kills the program early.” Argue the other side — when is generating a killing result too aggressive?
- Development faces more compounds, shorter timelines, and flat staffing. Pick one lever from the earlier sections (QbD, automation, PAT, knowledge management) and estimate, qualitatively, where it actually saves money.
- A colleague proposes tightening an impurity specification “to be safe.” Walk through the cost of that decision over the product’s commercial life.
Source note. This section is an economic framing, not a single guideline, and the figures are ranges rather than facts — present them that way. Anchors: J. A. DiMasi, H. G. Grabowski & R. W. Hansen, “Innovation in the pharmaceutical industry: New estimates of R&D costs” (Journal of Health Economics, 2016) and the associated Tufts CSDD briefing — the ~$2.6 billion capitalised figure, and the preclinical/clinical split (preclinical ≈ 32 % of out-of-pocket, ≈ 42 % of capitalised cost); O. J. Wouters, M. McKee & J. Luyten, “Estimated Research and Development Investment Needed to Bring a New Medicine to Market, 2009–2018” (JAMA, 2020) — median ~$985 million, mean ~$1.3 billion, and an explicit critique of the higher estimates; A. Sertkaya et al., “Costs of Drug Development and Research and Development Intensity in the US, 2000–2018” (JAMA Network Open, 2024) — how much of the per-drug figure is attributable to failures; the U.S. Congressional Budget Office, “Research and Development in the Pharmaceutical Industry” (2021) — an independent overview of R&D spend, pricing, and how patents and exclusivity let costs be recouped; A. Sertkaya et al., “Examination of Clinical Trial Costs and Barriers for Drug Development” (ASPE / HHS, 2014) — per-patient and per-phase clinical trial costs and the recruitment barrier; C. H. Wong, K. W. Siah & A. W. Lo, “Estimation of clinical trial success rates and related parameters” (Biostatistics, 2019) and the BIO/Informa “Clinical Development Success Rates” reports — the ~10 % Phase I-to-approval figure; and, for the ritonavir polymorph episode, S. R. Chemburkar et al. (Organic Process Research & Development, 2000) and J. Bauer et al. (Pharmaceutical Research, 2001). Patient-recruitment operational statistics (80 % of trials delayed, ~$6,500/patient, up to ~$8 million/day of delay) are widely cited across the CRO and clinical-operations literature; see the patient recruitment overview for entry points. (Instructor: produce the section infographic as image.png. Decide which single cost figure to lead with in lecture and stick to it — the range is the teaching point, but students want one number. The “~37 % on clinical affairs” and “> 60 % on discovery + development” figures come from the internal teaching deck; reconcile them with whichever published breakdown you assign, and note that the percentages move with definitions.)