Dissolution — The Performance Test
Dissolution as the one routine test about the patient’s experience rather than the molecule’s identity: the USP/Ph. Eur. apparatus, what has to be controlled — medium, sink conditions, agitation — biorelevant versus QC media, discriminating power, IVIVC and biowaivers, and the staged USP ⟨711⟩ acceptance criteria.
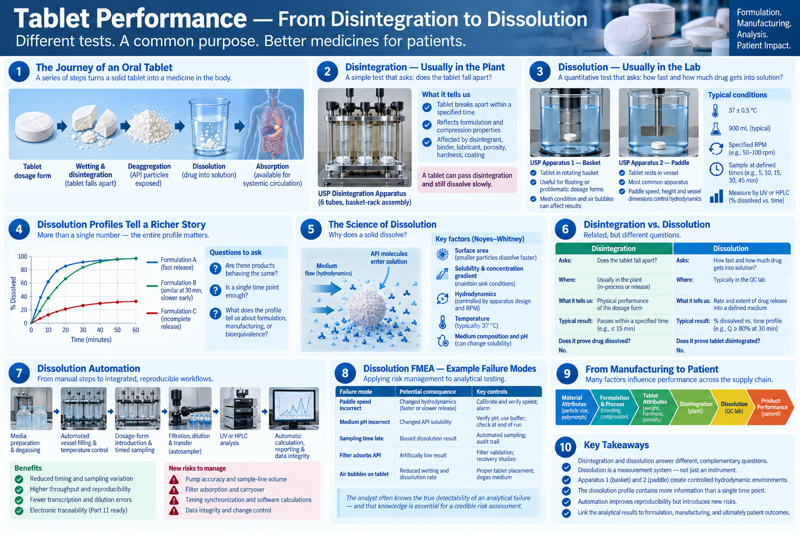
One-page overview of 'Tablet Performance — From Disintegration to Dissolution,' subtitled 'Different tests. A common purpose. Better medicines for patients.' Ten numbered panels: (1) The Journey of an Oral Tablet — a series of steps turns a solid tablet into a medicine in the body, shown left to right: tablet dosage form → wetting & disintegration (tablet falls apart) → deaggregation (API particles exposed) → dissolution (drug into solution) → absorption (available for systemic circulation); (2) Disintegration — Usually in the Plant, a simple test asking does the tablet fall apart, with a photo of the USP disintegration apparatus (6 tubes, basket-rack assembly) and what it tells us (tablet breaks apart within a specified time, reflects formulation and compression properties, affected by disintegrant/binder/lubricant/porosity/hardness/coating), with the callout that a tablet can pass disintegration and still dissolve slowly; (3) Dissolution — Usually in the Lab, a quantitative test asking how fast and how much drug gets into solution, with photos of USP Apparatus 1 — Basket (tablet in rotating basket, useful for floating or problematic dosage forms, mesh condition and air bubbles can affect results) and USP Apparatus 2 — Paddle (tablet rests in vessel, most common apparatus, paddle speed/height/vessel dimensions control hydrodynamics), plus typical conditions (37 ± 0.5 °C, 900 mL typical volume, specified RPM e.g. 50-100, sample at defined times e.g. 5/10/15/30/45 min, measured by UV or HPLC as % dissolved vs. time); (4) Dissolution Profiles Tell a Richer Story — a % dissolved vs. time chart comparing Formulation A (fast release), B (similar at 30 min, slower early), and C (incomplete release), with questions to ask: are these products behaving the same, is a single time point enough, what does the profile tell us about formulation, manufacturing, or bioequivalence; (5) The Science of Dissolution — why does a solid dissolve, illustrated with API molecules entering solution from a particle in a medium flow (hydrodynamics), and the Noyes-Whitney key factors: surface area (smaller particles dissolve faster), solubility and concentration gradient (maintain sink conditions), hydrodynamics (controlled by apparatus design and RPM), temperature (typically 37 °C), medium composition and pH (can change solubility); (6) Disintegration vs. Dissolution, a side-by-side table — disintegration asks does the tablet fall apart (usually in the plant, in-process or release testing, passes within a specified time e.g. ≤15 min, does not prove drug dissolved) versus dissolution asks how fast and how much drug gets into solution (typically in the QC lab, % dissolved vs. time profile e.g. Q ≥80% at 30 min, does not prove tablet disintegrated); (7) Dissolution Automation — from manual steps to integrated, reproducible workflows: media preparation and degassing → automated vessel filling and temperature control → dosage-form introduction and timed sampling → filtration, dilution and transfer (autosampler) → UV or HPLC analysis → automatic calculation, reporting and data integrity, with benefits (reduced timing and sampling variation, higher throughput and reproducibility, fewer transcription and dilution errors, electronic traceability/Part 11 ready) and new risks to manage (pump accuracy and sample-line volume, filter adsorption and carryover, timing synchronization and software calculations, data integrity and change control); (8) Dissolution FMEA — Example Failure Modes, applying risk management to analytical testing: a table of failure mode → potential consequence → key controls, covering paddle speed incorrect (changed hydrodynamics → calibrate and verify speed, alarm), medium pH incorrect (changed API solubility → verify pH, use buffer, check at end of run), sampling time late (biased dissolution result → automated sampling, audit trail), filter adsorbs API (artificially low result → filter validation, recovery studies), air bubbles on tablet (reduced wetting and dissolution rate → proper tablet placement, degas medium) — with the note that the analyst often knows the true detectability of an analytical failure, and that knowledge is essential for a credible risk assessment; (9) From Manufacturing to Patient — a chevron of factors influencing performance across the supply chain: material attributes (particle size, polymorph) → formulation & process (blending, compression) → tablet attributes (weight, hardness, porosity) → disintegration (plant) → dissolution (QC lab) → product performance (patient); (10) Key Takeaways — disintegration and dissolution answer different, complementary questions; dissolution is a measurement system, not just an instrument; Apparatus 1 (basket) and 2 (paddle) create controlled hydrodynamic environments; the dissolution profile contains more information than a single time point; automation improves reproducibility but introduces new risks; link the analytical results to formulation, manufacturing, and ultimately patient outcomes.

Assay tests ask what is in the tablet. Dissolution asks what gets out of it, and how fast — a surrogate for the rate and extent of absorption in a patient. It is the one routine test in this course that is about the patient’s experience rather than the molecule’s identity, and it is where the coating decisions from Week 2’s solid-dosage manufacturing section get proven or disproven.

The one idea

A dissolution method that passes every batch you have ever made is not necessarily good news — it may just mean it isn’t discriminating enough to tell a good batch from a bad one.

The apparatus (USP / Ph. Eur.)

ApparatusNameTypical use
1BasketCapsules, floating dosage forms
2PaddleThe default for tablets
3Reciprocating cylinderExtended-release, pH-change profiles
4Flow-through cellLow-solubility drugs, implants, modified-release; open or closed loop
5–7Paddle-over-disk, cylinder, reciprocating holderTransdermals and other special forms

What has to be controlled

The medium (volume, pH, surfactant, degassing), temperature (37 °C), agitation, and — most easily overlooked — sink conditions: enough medium that the dissolved drug never approaches its saturation solubility, or the measured rate is limited by the medium, not by the product. Violate sink conditions and the result describes the bath, not the tablet.

Biorelevant and discriminating media

Simple buffers are used for routine QC; biorelevant media (FaSSIF/FeSSIF, simulating fasted/fed intestinal fluid) are used in development to predict in-vivo behaviour. A good QC method is discriminating — it responds to the formulation and process changes that would matter clinically, and ignores the ones that wouldn’t. Building that discrimination, and then proving it, is the hard part of method development, harder by far than running the test itself.

IVIVC and the biowaiver

An in-vitro / in-vivo correlation links the dissolution profile to a pharmacokinetic profile. A validated Level A IVIVC can support a biowaiver — a formulation or manufacturing-site change approved on dissolution data alone, instead of a new bioequivalence study in humans. This is the direct payoff of a discriminating method: it lets a change be defended with a bench test instead of a clinical one.

Acceptance criteria, staged

USP ⟨711⟩ builds a sampling design directly into the acceptance criteria — not a single pass/fail: test 6 units (S1), and only if that’s inconclusive, 6 more (S2), and only if still inconclusive, 12 more (S3), with the allowed variability widening at each stage. A batch can pass at S1 cleanly, pass at S3 only marginally, or fail outright — and each of those tells you something different about how close to the edge the batch really is.

Where the analyst sits

Is this dissolution method actually discriminating, or does it pass every batch including the ones that would underperform in a patient? That question has no compendial answer — it is answered by deliberately manufacturing batches with known defects (over-compressed, under-coated, wrong particle size) and confirming the method tells them apart. A method that has never been challenged that way hasn’t earned its trust yet, no matter how many batches it has passed.

For discussion

  • A dissolution method passes every batch you have ever made. How would you go about finding out whether it actually discriminates?
  • “Sink conditions” — why does violating them make a dissolution result meaningless, and how would you detect that you had?
  • A batch fails at S1, is retested at S2, and passes comfortably. What does that sequence tell you about the batch that a single S1 result would not?
  • A functional (extended-release) coating passes appearance and weight-gain checks but the batch fails dissolution — connect this back to Week 2’s coating section: what upstream step would you investigate first?

Source note. Dissolution: USP ⟨711⟩ / ⟨724⟩ / ⟨1092⟩, Ph. Eur. 2.9.3, the FDA dissolution and BCS-biowaiver guidances.