Risk Ranking and Filtering — Comparing Risks That Don't Share a Scale
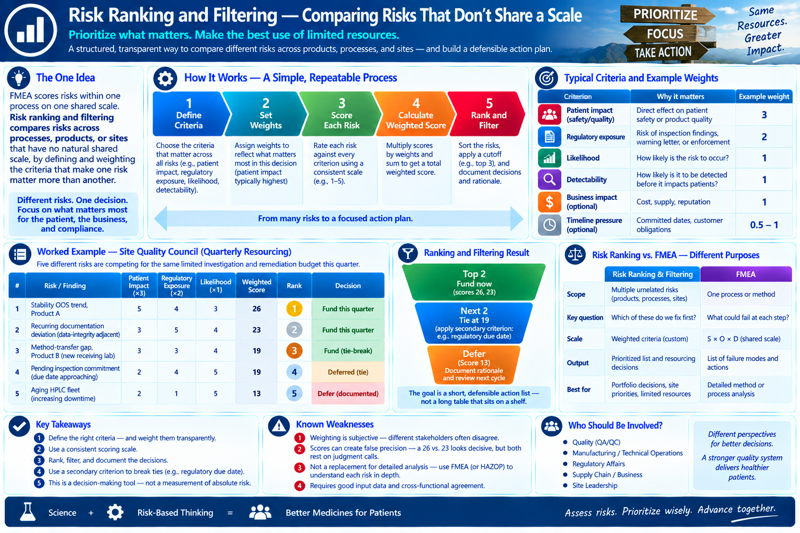
When risks come from different processes, products, or sites and don’t share a common scale, risk ranking and filtering normalizes them against weighted criteria to build one prioritized list — worked through a site quality council’s quarterly resourcing decision.
A banner titled 'Risk Ranking and Filtering — Comparing Risks That Don't Share a Scale' with the tagline 'Prioritize what matters. Make the best use of limited resources.' and the note that this is a structured, transparent way to compare different risks across products, processes, and sites — and build a defensible action plan. Panels: (1) The One Idea — FMEA scores risks within one process on one shared scale; risk ranking and filtering compares risks across processes, products, or sites that have no natural shared scale, by defining and weighting the criteria that make one risk matter more than another, captioned 'Different risks. One decision. Focus on what matters most for the patient, the business, and compliance.'; (2) How It Works — A Simple, Repeatable Process, a five-step chevron: define criteria (choose the criteria that matter across all risks, e.g. patient impact, regulatory exposure, likelihood, detectability), set weights (assign weights to reflect what matters most in this decision — patient impact typically highest), score each risk (rate each risk against every criterion using a consistent scale, e.g. 1–5), calculate weighted score (multiply scores by weights and sum to get a total weighted score), rank and filter (sort the risks, apply a cutoff e.g. top 3, and document decisions and rationale) — captioned 'From many risks to a focused action plan.'; (3) Typical Criteria and Example Weights — a table of six criteria with why it matters and an example weight: patient impact/safety/quality (direct effect on patient safety or product quality, weight 3), regulatory exposure (risk of inspection findings, warning letter, or enforcement, weight 2), likelihood (how likely the risk is to occur, weight 1), detectability (how likely it is to be detected before it impacts patients, weight 1), business impact — optional (cost, supply, reputation, weight 1), timeline pressure — optional (committed dates, customer obligations, weight 0.5–1); (4) Worked Example — Site Quality Council (Quarterly Resourcing): five risks competing for the same limited investigation and remediation budget this quarter, in a table with patient impact (×3), regulatory exposure (×2), likelihood (×1), weighted score, rank, and decision — stability OOS trend Product A (5,4,3 → 26, rank 1, fund this quarter), recurring documentation deviation/data-integrity adjacent (3,5,4 → 23, rank 2, fund this quarter), method-transfer gap Product B new receiving lab (3,3,4 → 19, rank 3, fund as tie-break), pending inspection commitment due date approaching (2,4,5 → 19, rank 4, deferred/tie), aging HPLC fleet increasing downtime (2,1,5 → 13, rank 5, defer/documented); (5) Ranking and Filtering Result — a funnel: Top 2 fund now (scores 26, 23), Next 2 tie at 19 (apply a secondary criterion, e.g. regulatory due date), Defer (score 13, document rationale and review next cycle), captioned 'The goal is a short, defensible action list — not a long table that sits on a shelf.'; (6) Risk Ranking vs. FMEA — Different Purposes, a comparison table across scope (multiple unrelated risks across products/processes/sites vs. one process or method), key question (which of these do we fix first vs. what could fail at each step), scale (weighted criteria, custom vs. S×O×D, a shared scale), output (prioritized list and resourcing decisions vs. list of failure modes and actions), best for (portfolio decisions, site priorities, limited resources vs. detailed method or process analysis); (7) Key Takeaways — define the right criteria and weight them transparently; use a consistent scoring scale; rank, filter, and document the decisions; use a secondary criterion to break ties (e.g. regulatory due date); this is a decision-making tool, not a measurement of absolute risk; (8) Known Weaknesses — weighting is subjective, different stakeholders often disagree; scores can create false precision — a 26 vs. 23 looks decisive but both rest on judgment calls; not a replacement for detailed analysis — use FMEA (or HAZOP) to understand each risk in depth; requires good input data and cross-functional agreement; (9) Who Should Be Involved? — Quality (QA/QC), Manufacturing/Technical Operations, Regulatory Affairs, Supply Chain/Business, Site Leadership, with the note that different perspectives lead to better decisions, and a stronger quality system delivers healthier patients. Footer: 'Science + Risk-Based Thinking = Better Medicines for Patients,' Temple University branding, and the tagline 'Assess risks. Prioritize wisely. Advance together.'

The one idea

FMEA scores risks within one process on one shared scale. Risk ranking and filtering compares risks across processes, products, or sites that have no natural shared scale at all, by explicitly defining and weighting the criteria that make one risk matter more than another.

Mechanics

  1. Define criteria that matter across every risk being compared — typically patient impact, regulatory exposure, likelihood, and detectability, though a portfolio-level exercise might add business impact or timeline pressure.
  2. Weight the criteria to reflect what actually matters most in this decision (patient impact usually carries the most weight; timeline pressure usually carries the least, if it’s included at all).
  3. Score each risk against every criterion, using whatever scale is practical (often 1–5, sometimes qualitative bands converted to numbers).
  4. Compute a weighted score and rank — then filter: set a threshold or a headcount/budget cutoff and act on what clears it, explicitly documenting why anything below the line is being deferred.

The “filtering” half is as important as the ranking half — the exercise exists to produce a short, defensible action list, not just a long sorted table nobody acts on.

Worked example — a site quality council’s quarterly resourcing decision

Five unrelated findings are competing for the same limited investigation and remediation budget this quarter:

RiskPatient impact (×3)Regulatory exposure (×2)Likelihood (×1)Weighted score
Stability OOS trend, Product A5435×3 + 4×2 + 3×1 = 26
Method-transfer gap, Product B (new receiving lab)3343×3 + 3×2 + 4×1 = 19
Aging HPLC fleet (increasing downtime)2152×3 + 1×2 + 5×1 = 13
Recurring documentation deviation (data-integrity adjacent)3543×3 + 5×2 + 4×1 = 23
Pending inspection commitment (due date approaching)2452×3 + 4×2 + 5×1 = 19

Ranked and filtered against a “fund the top three this quarter” cutoff: the stability OOS trend (26) and the documentation deviation (23) fund first regardless of tiebreaks; the method-transfer gap and the inspection commitment tie at 19 and need a secondary criterion (e.g., regulatory due date) to break the tie for the third slot. The aging-fleet risk (13) is explicitly deferred — not ignored, documented as deferred, with the reasoning on record for the next review cycle.

When to reach for it vs. FMEA

Use risk ranking and filtering when the decision spans multiple unrelated risks competing for the same finite resource — funding, staffing, audit time — not when you’re working through the failure modes of a single process or method, which is FMEA’s job. It’s the tool for “which of these five different problems do we fix first,” not “what could go wrong in this one method.”

Known weaknesses

  • The weighting scheme is itself a subjective judgment call — this is the same criticism Q9(R1) raises about FMEA’s Severity/Occurrence/Detection scoring; risk ranking and filtering doesn’t remove that subjectivity, it just moves it up a level, from scoring individual failure modes to weighting the criteria that compare them.
  • Different stakeholders (quality, manufacturing, regulatory affairs) often disagree on the weights themselves — reaching agreement on the weighting is frequently the harder part of the exercise, not the scoring.
  • A weighted score can create false precision — a 26 vs. a 23 looks decisive, but both numbers rest on the same soft inputs as any other risk score, and the ranking should be sanity-checked qualitatively before being treated as a tiebreaker.