Ishikawa / Fishbone / PHA — Structuring the First Pass
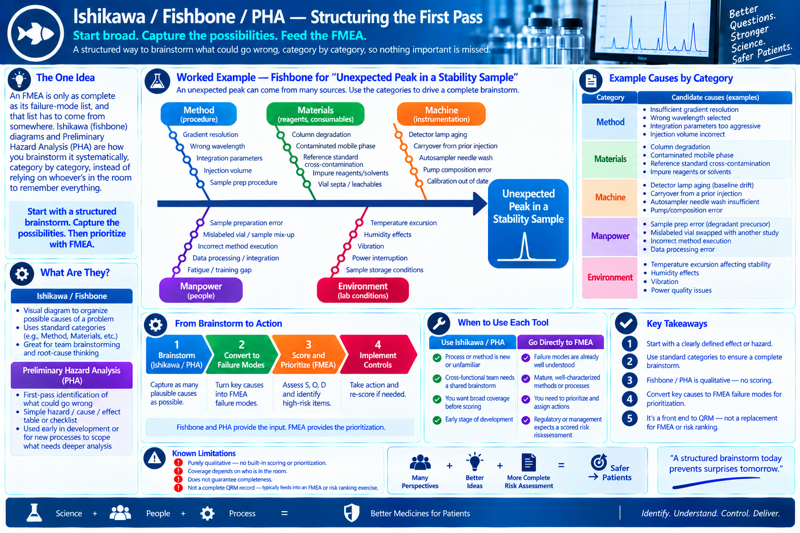
Before an FMEA can score failure modes, it needs a reasonably complete list of them — fishbone diagrams and Preliminary Hazard Analysis are how that list gets brainstormed systematically, worked through an unexpected-peak example that feeds directly into an FMEA.
A banner titled 'Ishikawa / Fishbone / PHA — Structuring the First Pass' with the tagline 'Start broad. Capture the possibilities. Feed the FMEA.' and the note that this is a structured way to brainstorm what could go wrong, category by category, so nothing important is missed. Panels: (1) The One Idea — an FMEA is only as complete as its failure-mode list, and that list has to come from somewhere; Ishikawa (fishbone) diagrams and Preliminary Hazard Analysis (PHA) are how you brainstorm it systematically, category by category, instead of relying on whoever's in the room to remember everything, captioned 'Start with a structured brainstorm. Capture the possibilities. Then prioritize with FMEA.'; (2) Worked Example — Fishbone for 'Unexpected Peak in a Stability Sample,' a fishbone diagram with five category branches (Method/procedure: gradient resolution, wrong wavelength, integration parameters, injection volume, sample prep procedure; Materials/reagents/consumables: column degradation, contaminated mobile phase, reference standard cross-contamination, impure reagents/solvents, vial septa/leachables; Machine/instrumentation: detector lamp aging, carryover from prior injection, autosampler needle wash, pump composition error, calibration out of date; Manpower/people: sample preparation error, mislabeled vial/sample mix-up, incorrect method execution, data processing/integration, fatigue/training gap; Environment/lab conditions: temperature excursion, humidity effects, vibration, power interruption, sample storage conditions) all pointing to the effect 'Unexpected Peak in a Stability Sample'; (3) Example Causes by Category — a table repeating the five categories (Method, Materials, Machine, Manpower, Environment) each with a bulleted list of candidate causes matching the fishbone diagram; (4) What Are They? — Ishikawa/Fishbone (a visual diagram to organize possible causes of a problem, uses standard categories like Method/Materials/etc., great for team brainstorming and root-cause thinking) and Preliminary Hazard Analysis/PHA (first-pass identification of what could go wrong, a simple hazard/cause/effect table or checklist, used early in development or for new processes to scope what needs deeper analysis); (5) From Brainstorm to Action — a four-step chevron: brainstorm (Ishikawa/PHA — capture as many plausible causes as possible), convert to failure modes (turn key causes into FMEA failure modes), score and prioritize (FMEA — assess S, O, D and identify high-risk items), implement controls (take action and re-score if needed) — captioned 'Fishbone and PHA provide the input. FMEA provides the prioritization.'; (6) When to Use Each Tool — a two-column comparison: use Ishikawa/PHA when the process or method is new or unfamiliar, a cross-functional team needs a shared brainstorm, you want broad coverage before scoring, or it's an early stage of development; go directly to FMEA when failure modes are already well understood, methods or processes are mature and well-characterized, you need to prioritize and assign actions, or regulatory/management expects a scored risk assessment; (7) Known Limitations — purely qualitative, no built-in scoring or prioritization; coverage depends on who is in the room; does not guarantee completeness; not a complete QRM record — typically feeds into an FMEA or risk-ranking exercise; (8) Key Takeaways — start with a clearly defined effect or hazard; use standard categories to ensure a complete brainstorm; fishbone/PHA is qualitative — no scoring; convert key causes to FMEA failure modes for prioritization; it's a front end to QRM, not a replacement for FMEA or risk ranking, with the summary equation 'Many Perspectives + Better Ideas + More Complete Risk Assessment = Safer Patients' and the quote 'A structured brainstorm today prevents surprises tomorrow.' Footer: 'Science + People + Process = Better Medicines for Patients,' Temple University branding, and the tagline 'Identify. Understand. Control. Deliver.'

The one idea

An FMEA is only as complete as its failure-mode list, and that list has to come from somewhere. Ishikawa (fishbone) diagrams and Preliminary Hazard Analysis are how you brainstorm it systematically, category by category, instead of relying on whoever’s in the room to remember everything from experience.

Mechanics

An Ishikawa diagram starts from a defined effect (an observed or feared problem) and branches into standard categories of contributing cause. Adapted for an analytical lab, the categories are usually:

  • Method — the procedure itself: parameters, steps, order of operations
  • Materials — reagents, standards, reference materials, columns, consumables
  • Machine — instrumentation: hardware, software, calibration state
  • Manpower — analyst training, technique, fatigue, handoffs
  • Environment — temperature, humidity, lighting, vibration, power quality

Preliminary Hazard Analysis (PHA) is a lighter, earlier-stage cousin — a first-pass brainstorm of what could possibly go wrong before a process even exists in detail, often just a simple hazard/cause/effect table, used to scope what a later, more formal risk assessment needs to cover.

Worked example — “unexpected peak in a stability sample”

CategoryCandidate causes brainstormed
MethodInsufficient gradient resolution; wrong wavelength selected; integration parameters too aggressive
MaterialsColumn degradation; contaminated mobile phase; reference standard cross-contamination
MachineDetector lamp aging (baseline drift creating false peaks); carryover from a prior injection; autosampler needle wash insufficient
ManpowerSample prep error introducing a degradant precursor; mislabeled vial swapped with another study
EnvironmentLab temperature excursion affecting sample stability between prep and injection

This is deliberately a long, unfiltered list — the point of the fishbone pass is coverage, not judgment. Three or four of these branches then become the failure-mode column of a follow-on FMEA: “contaminated mobile phase” becomes a scoreable failure mode with its own severity, occurrence, and detection; “detector lamp aging” becomes another. The fishbone did the brainstorming; the FMEA does the prioritizing.

When to reach for it vs. FMEA directly

Skip straight to FMEA when the failure modes are already well understood from experience — a mature, well-characterized method rarely needs a fresh fishbone pass. Reach for Ishikawa or PHA first when the process or method is new or unfamiliar, or when a cross-functional team is starting from very different mental models of what could go wrong and needs a shared, structured brainstorm before anyone starts scoring anything.

Known weaknesses

  • Purely qualitative — a fishbone diagram or PHA table has no scoring or prioritization built in; it can surface a long list of contributing factors without telling you which ones actually matter.
  • Coverage depends heavily on who’s in the room; the category headings help structure the brainstorm, but they don’t guarantee completeness the way a systematic top-down decomposition (like FMEA’s step-by-step structure) does.
  • It is not, on its own, a complete quality risk management record — it’s the front end that typically feeds into an FMEA or risk ranking and filtering exercise, not a substitute for either.